Overview
Inclusions are foreign materials or imperfections embedded within a material, component, or structure. They can impact mechanical properties, structural integrity, and overall performance. These inclusions may be solid (e.g., oxides, sulfides), gaseous (e.g., voids, pores), or liquid in nature.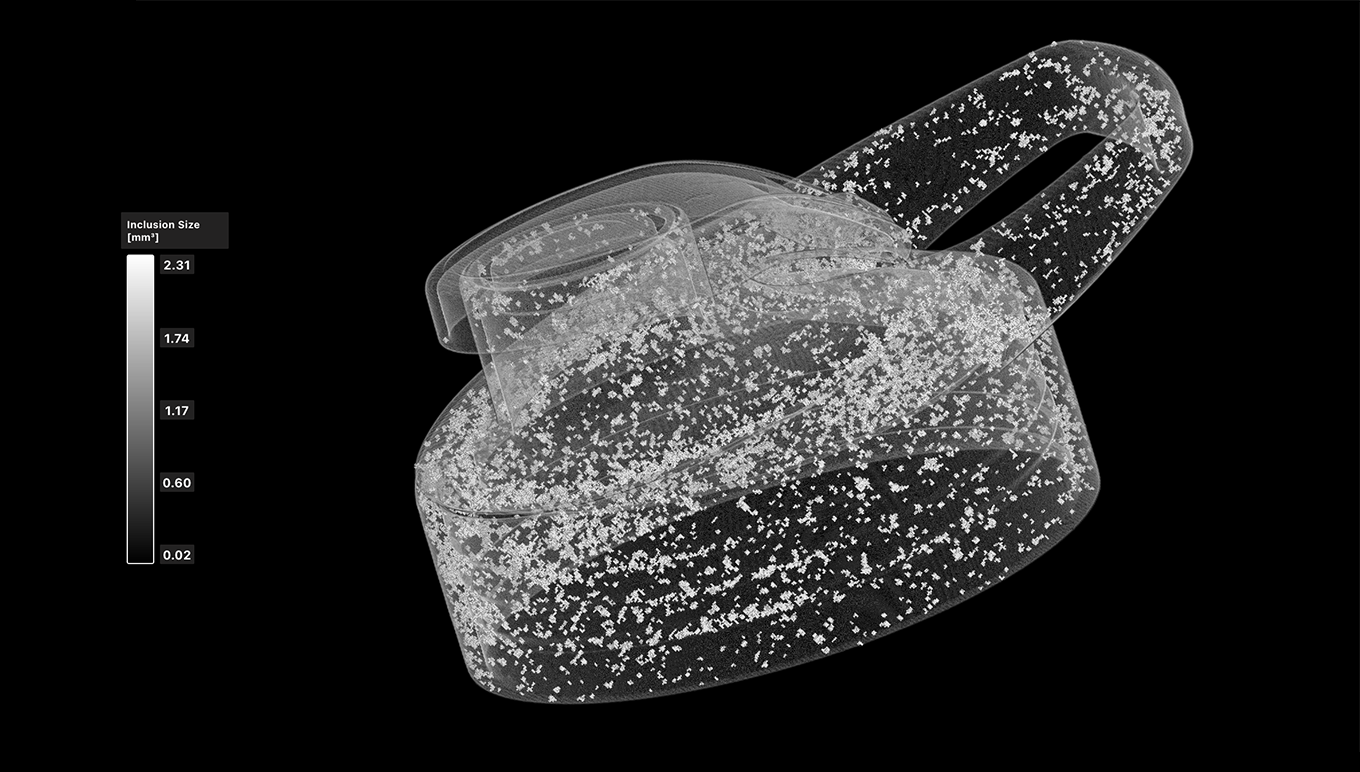
Drywall Mount
Inclusions within this drywall mount, such as slag or other foreign particles embedded in the material, can create weak points that may lead to failure under stress.
Water Bottle Lid
The recycled plastic regrind used in this water bottle lid has resulted in a crack due to the variation in density from the surrounding plastic.
Inclusion Analysis Setup
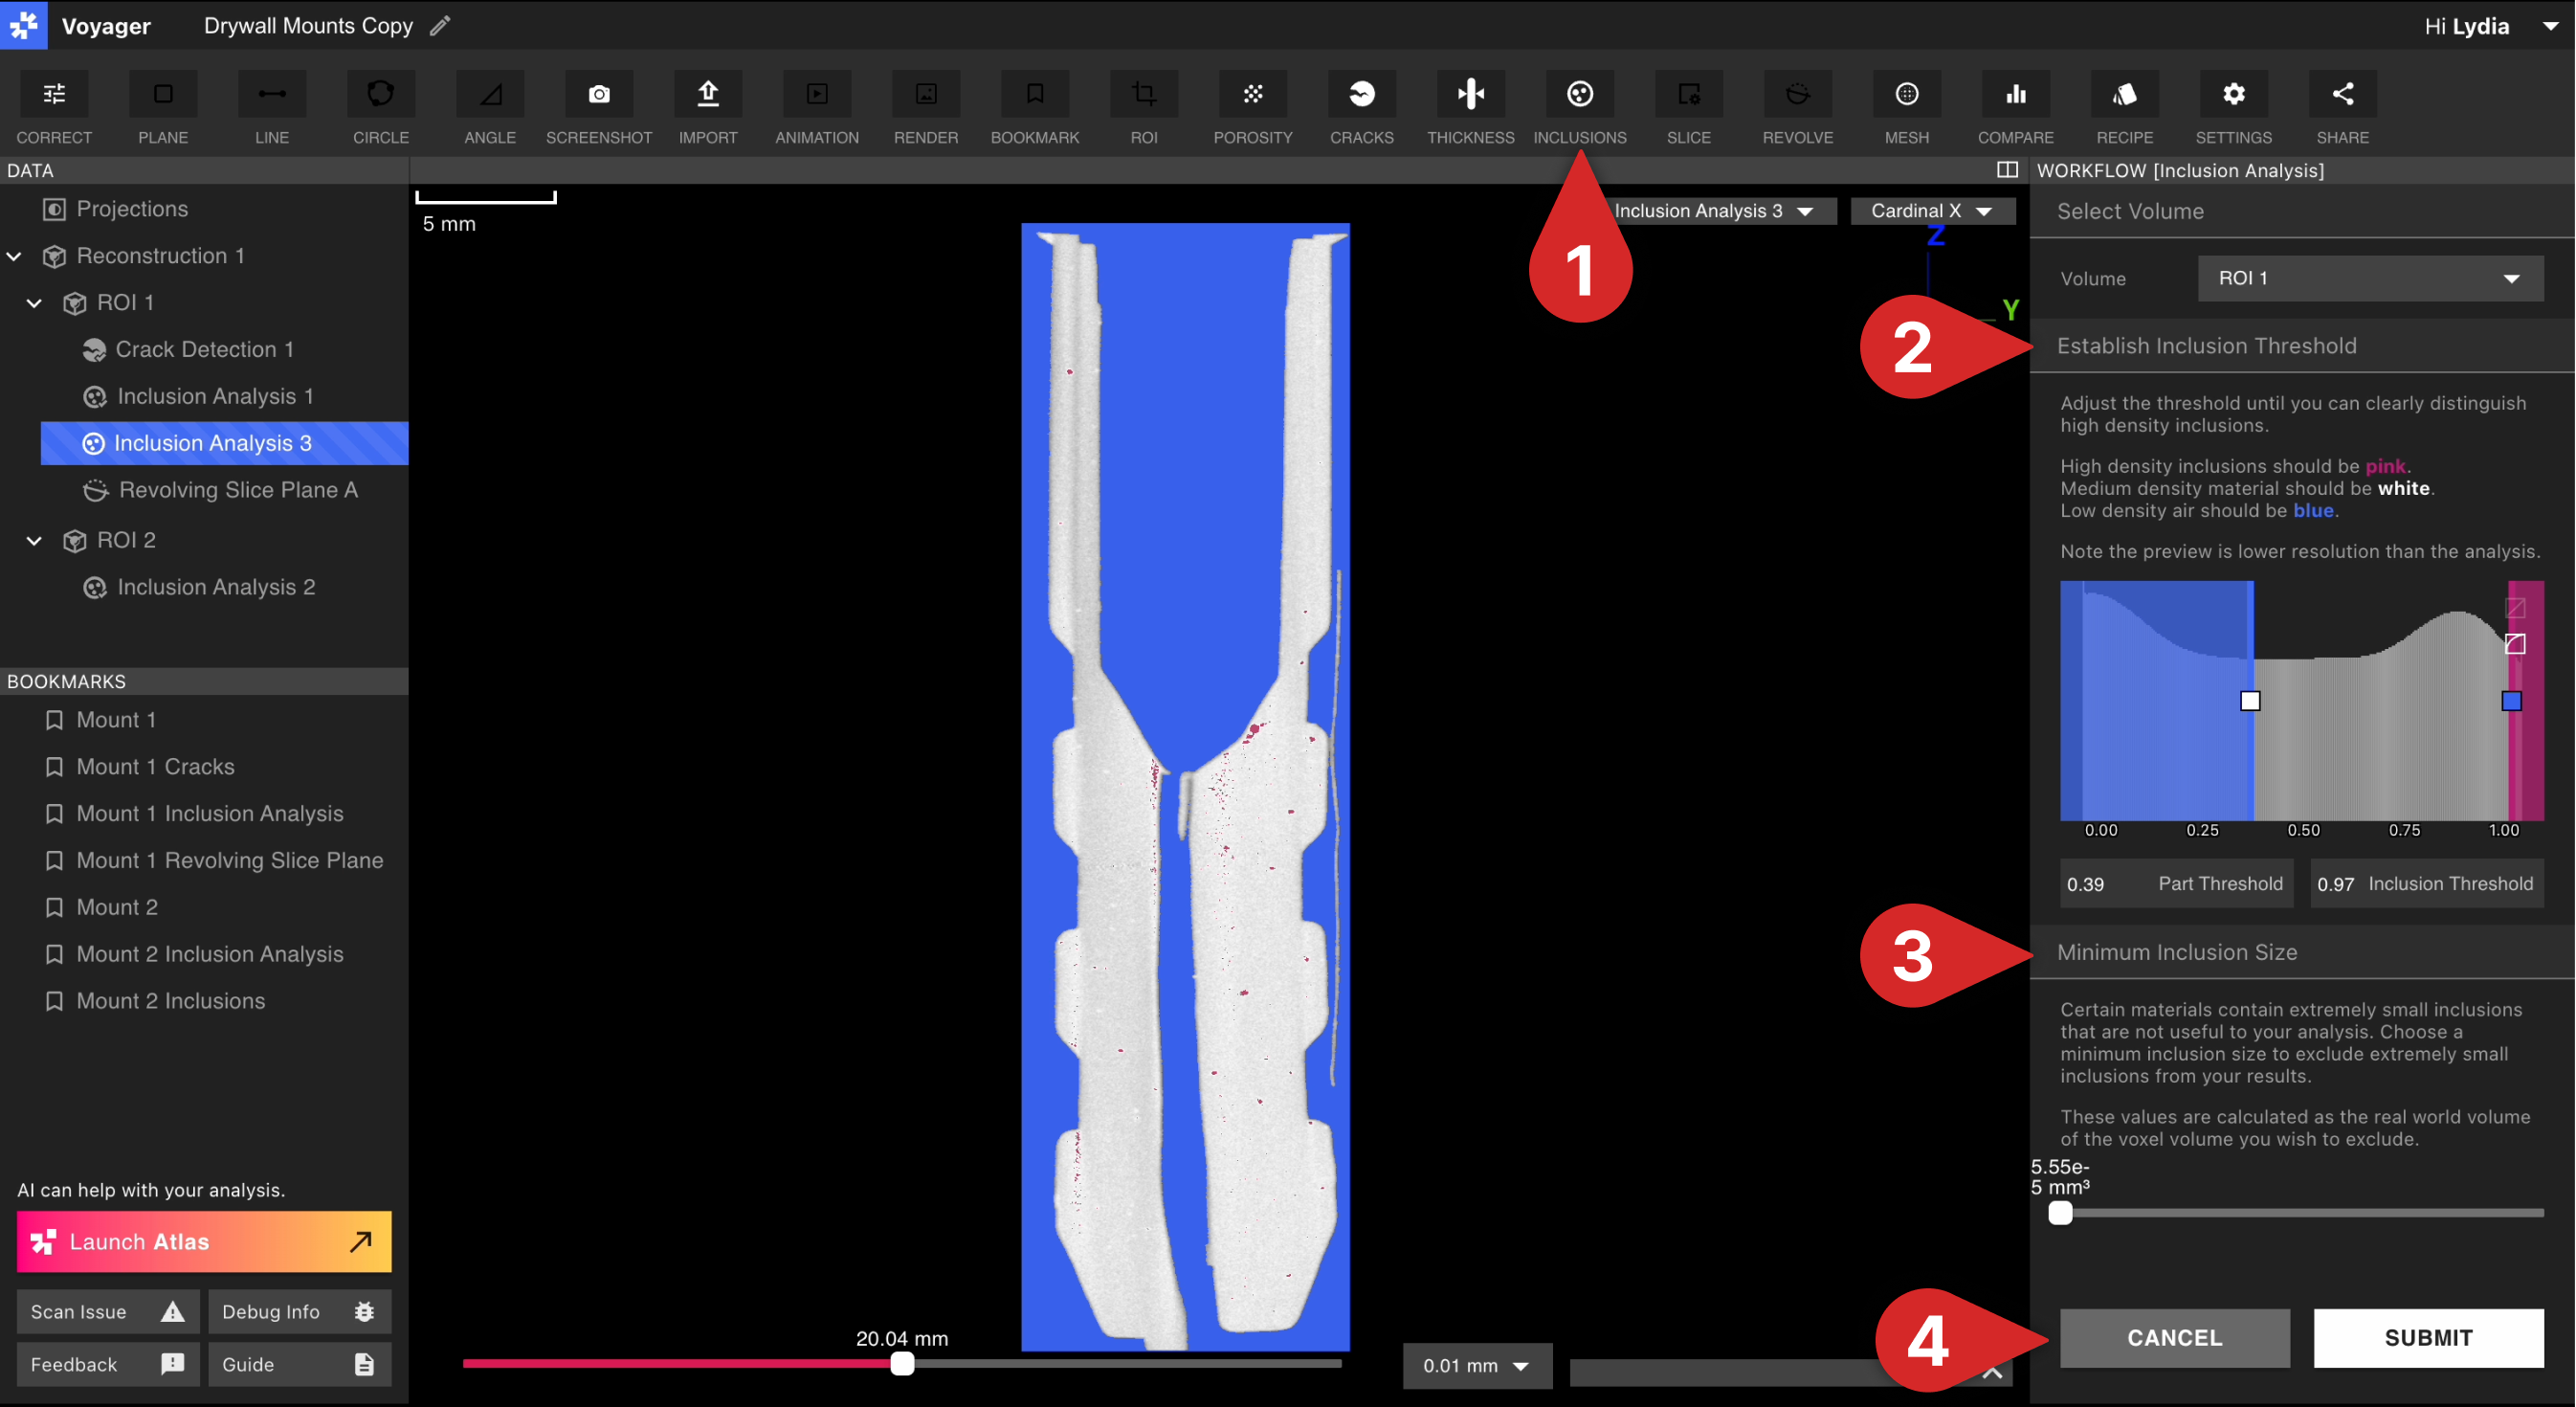
- Select a volume (Reconstruction or ROI) to run the analysis on and click on “Inclusions” in the top Toolbar. Alternatively, you can first select “Inclusions” and then choose a volume.
- Set an inclusion threshold on the volume. When selecting a threshold, verify that one or more inclusions are visible when scrubbing through the 2D slices (you can switch cardinal X, Y, Z axis views). As you adjust the threshold, inclusions that maintain a pink color – versus a blue or white color – are more likely to be detected.
- Set a max inclusion size to detect. Inclusions with a size smaller than this value will be surfaced once the analysis has been run.
- Click on “Submit” to run the analysis. You will receive a notification within the Project once the analysis has been completed so that you can view the results. Alternatively, you can safely close the Project – while the analysis runs in the background – and return later. You need not wait for an analysis to completely process before running another!
Analyzing Results
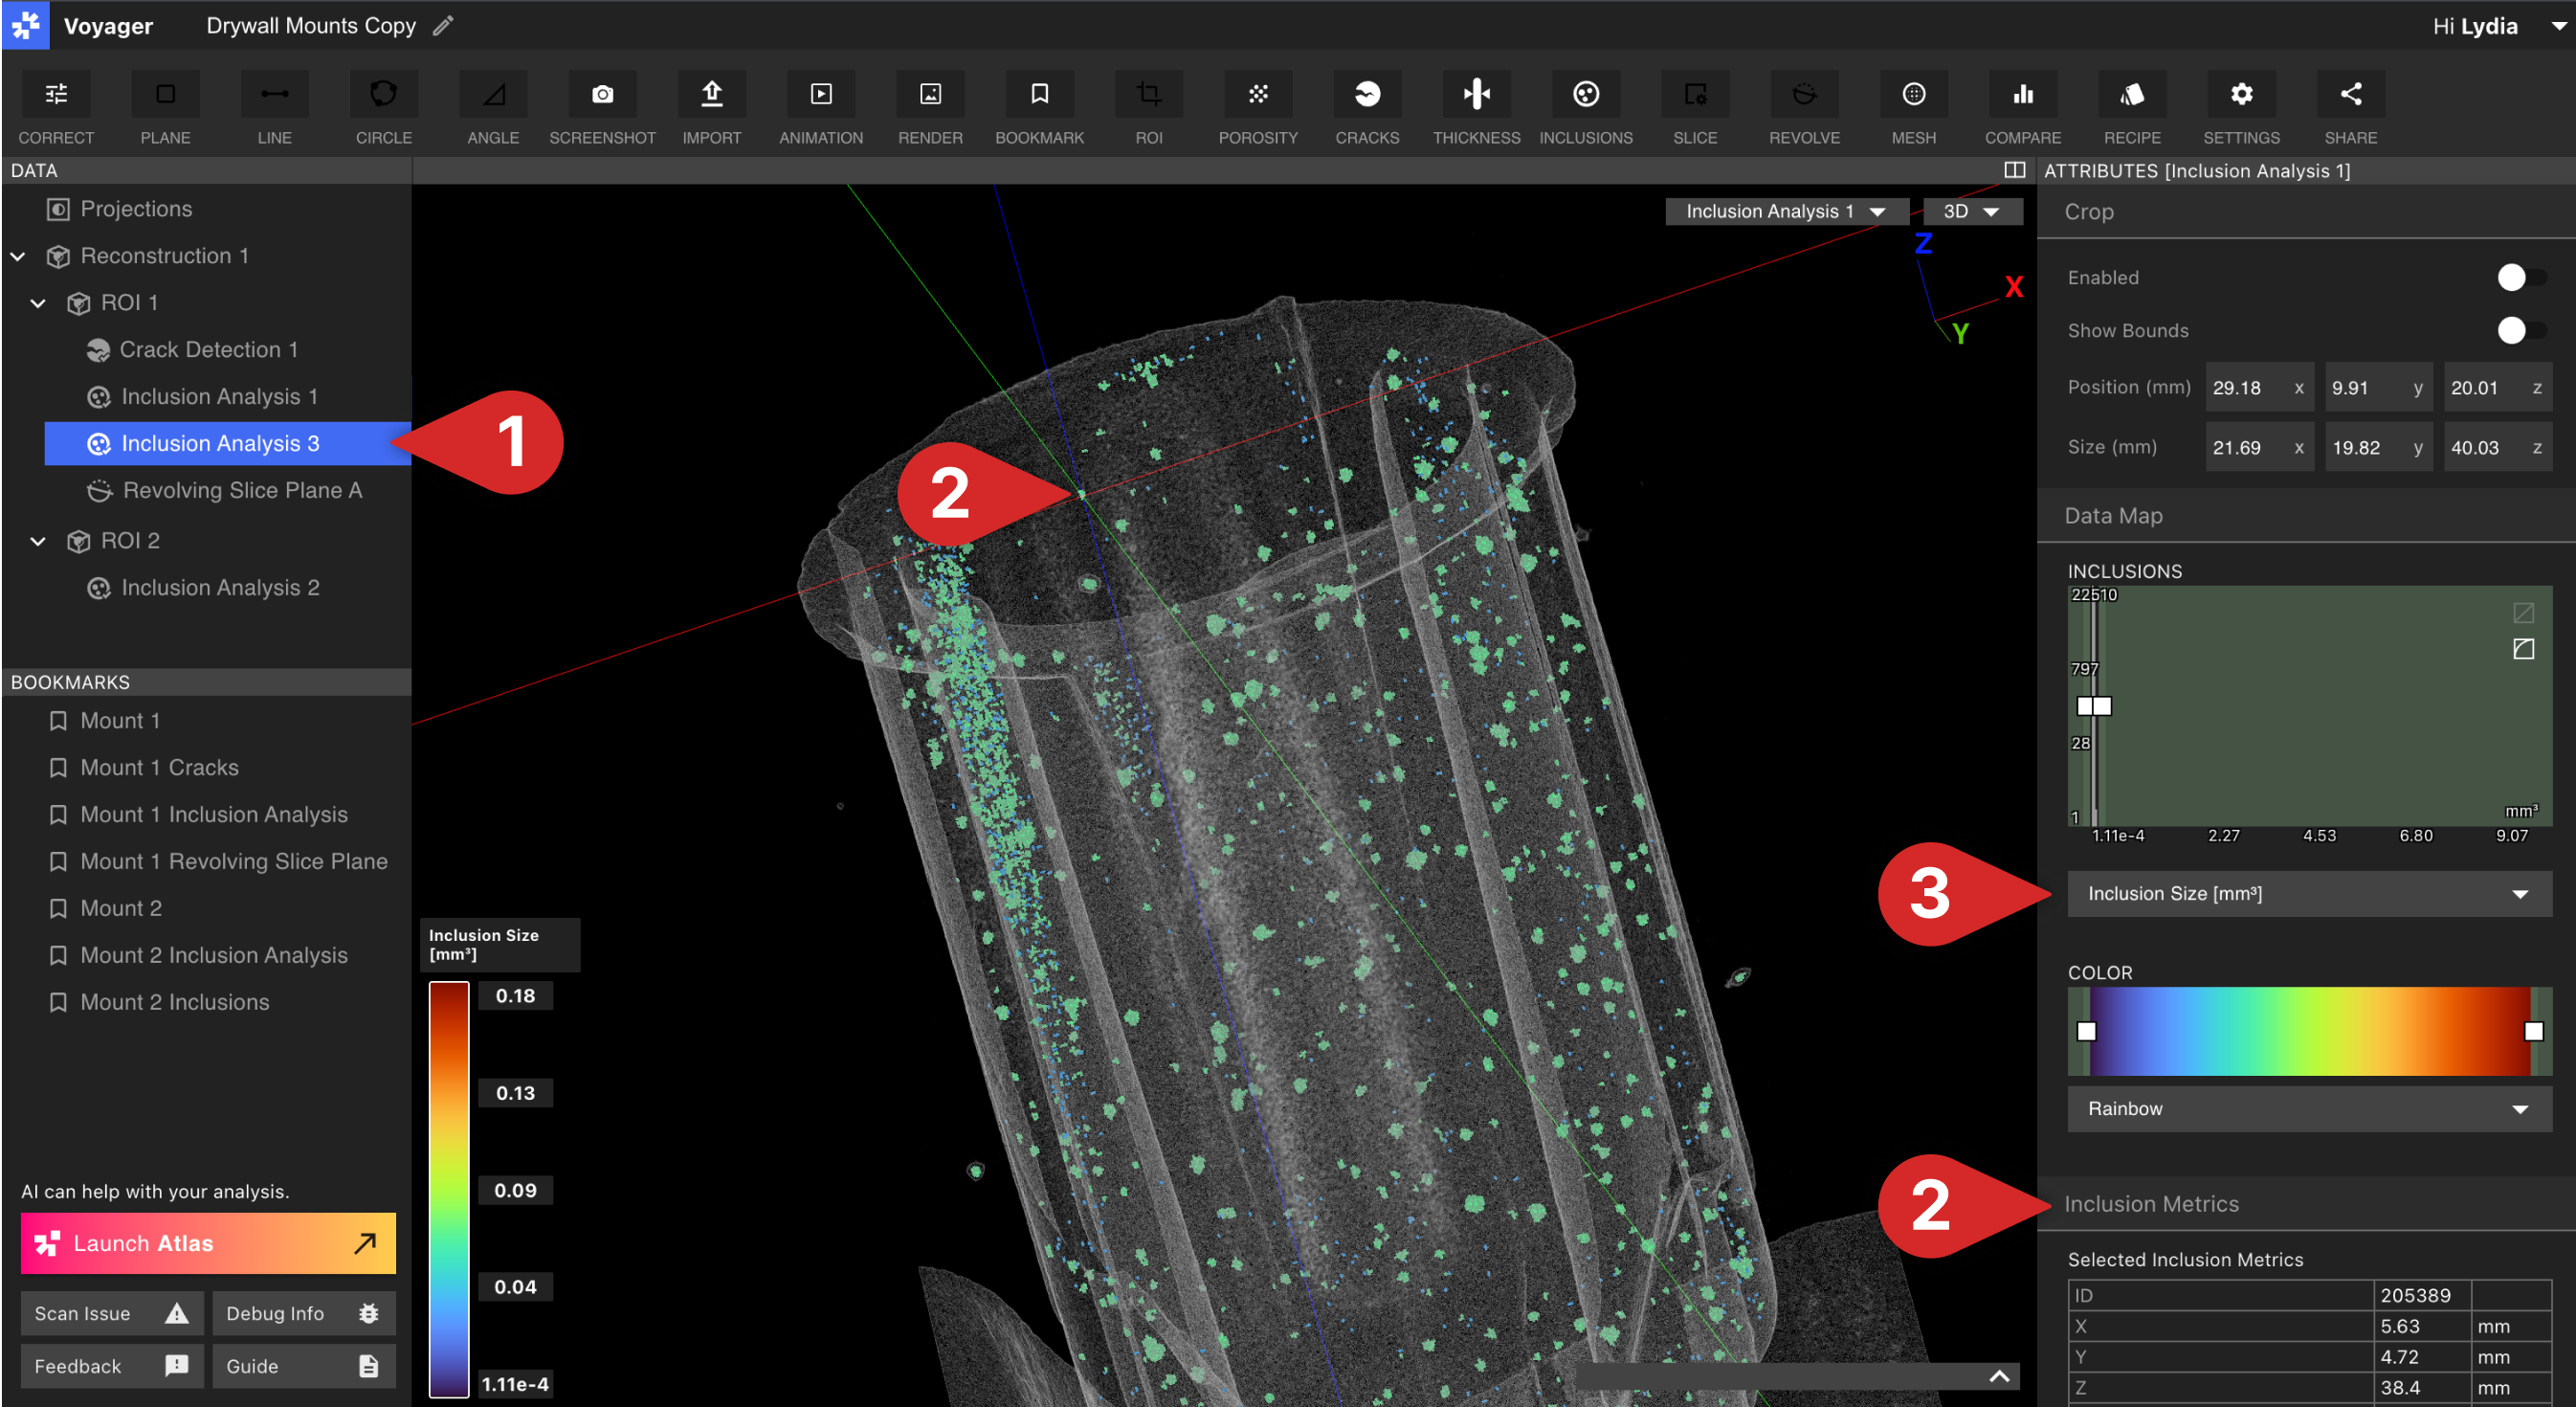
Once Voyager has run an Inclusion Analysis, you will find the analysis in the Data Panel on the left, nested under the volume on which it was run. Familiar tools like cropping, appearance and opacity, and slice axes function in the same manner as in other environments.- Select the Inclusion Analysis Data Object from the listed objects in the Data Panel. You can also view the Inclusion Analysis Data Object from the drop down in the top right corner of the Viewport.
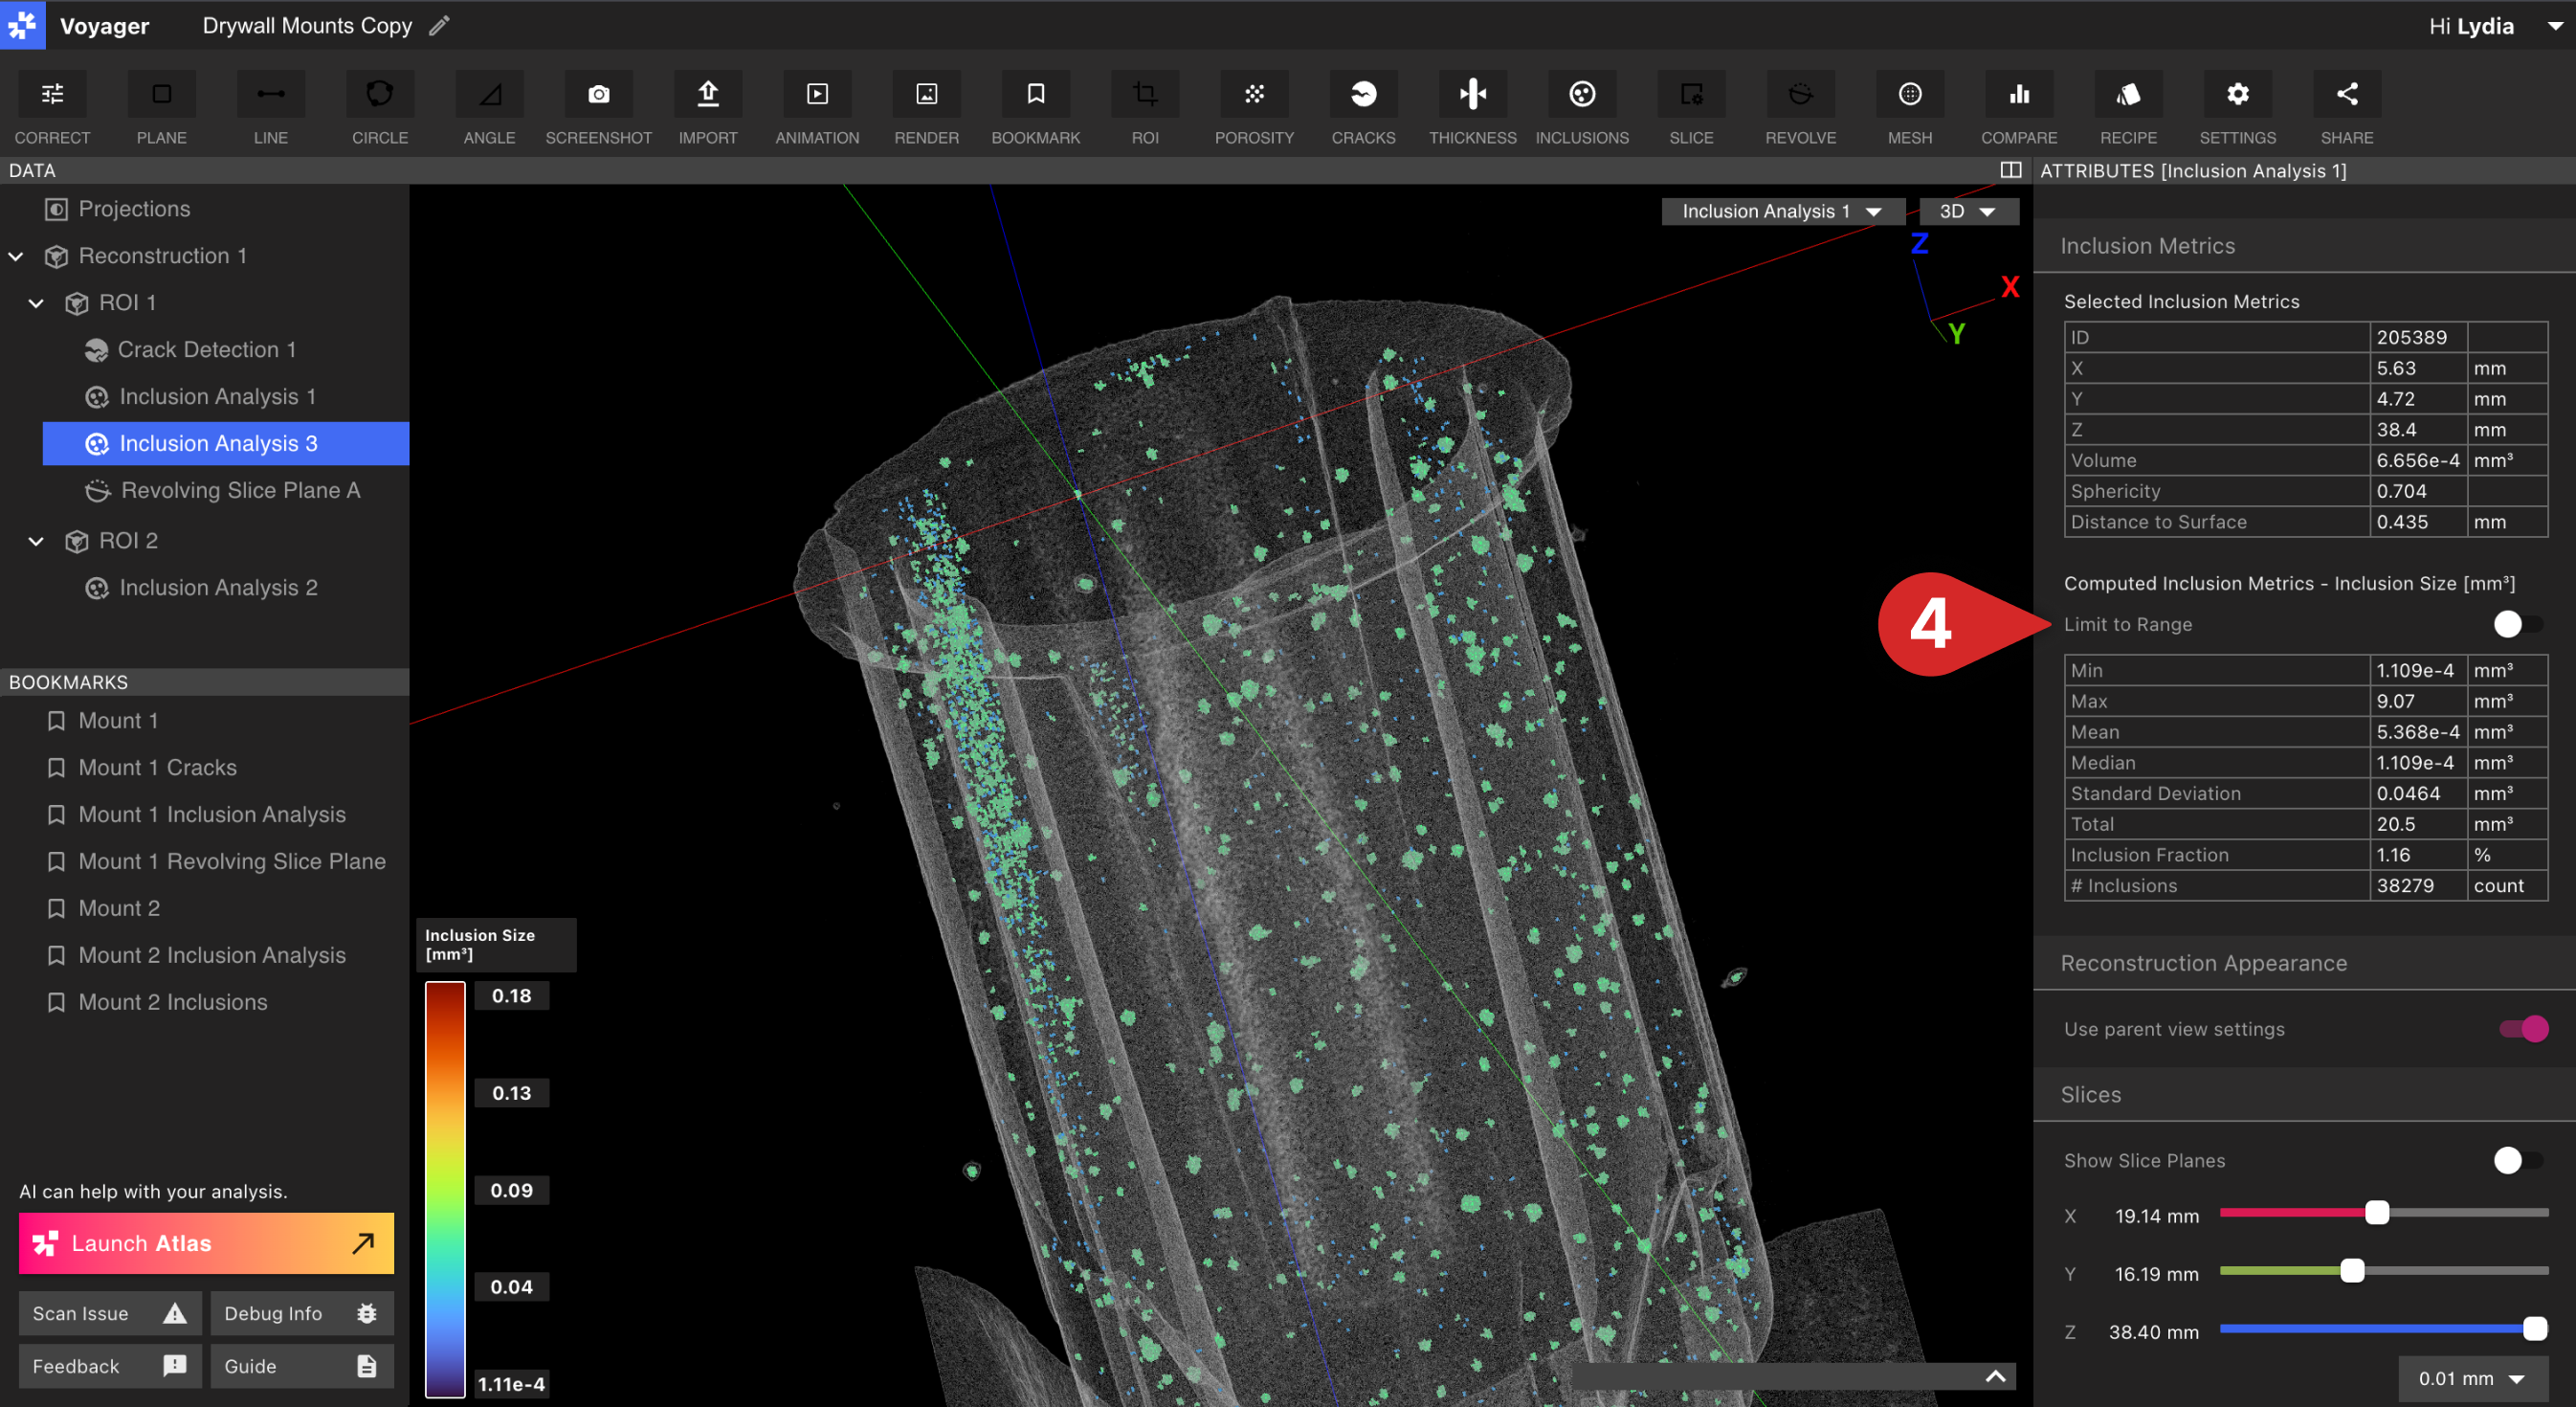
- Voyager will highlight detected inclusions throughout the volume of your scan: Select a single inclusion to view more detail or view the entire Inclusion Analysis Results. When you select a specific inclusion there will be a table in the right panel with the inclusion’s metrics. If there is not a specific inclusion selected, only the general inclusion metrics will be shown.
- Display inclusions by ID to locate specific defects and relate them directly to downloadable analysis reports. Modify an inclusion’s ID to a useful name in the Selected Pore Metrics section of the Porosity Metrics Tab.
- View 4 different data types; Inclusions (mm3), Sphericity, Distance to Surface (mm), and Max Diameter (mm).
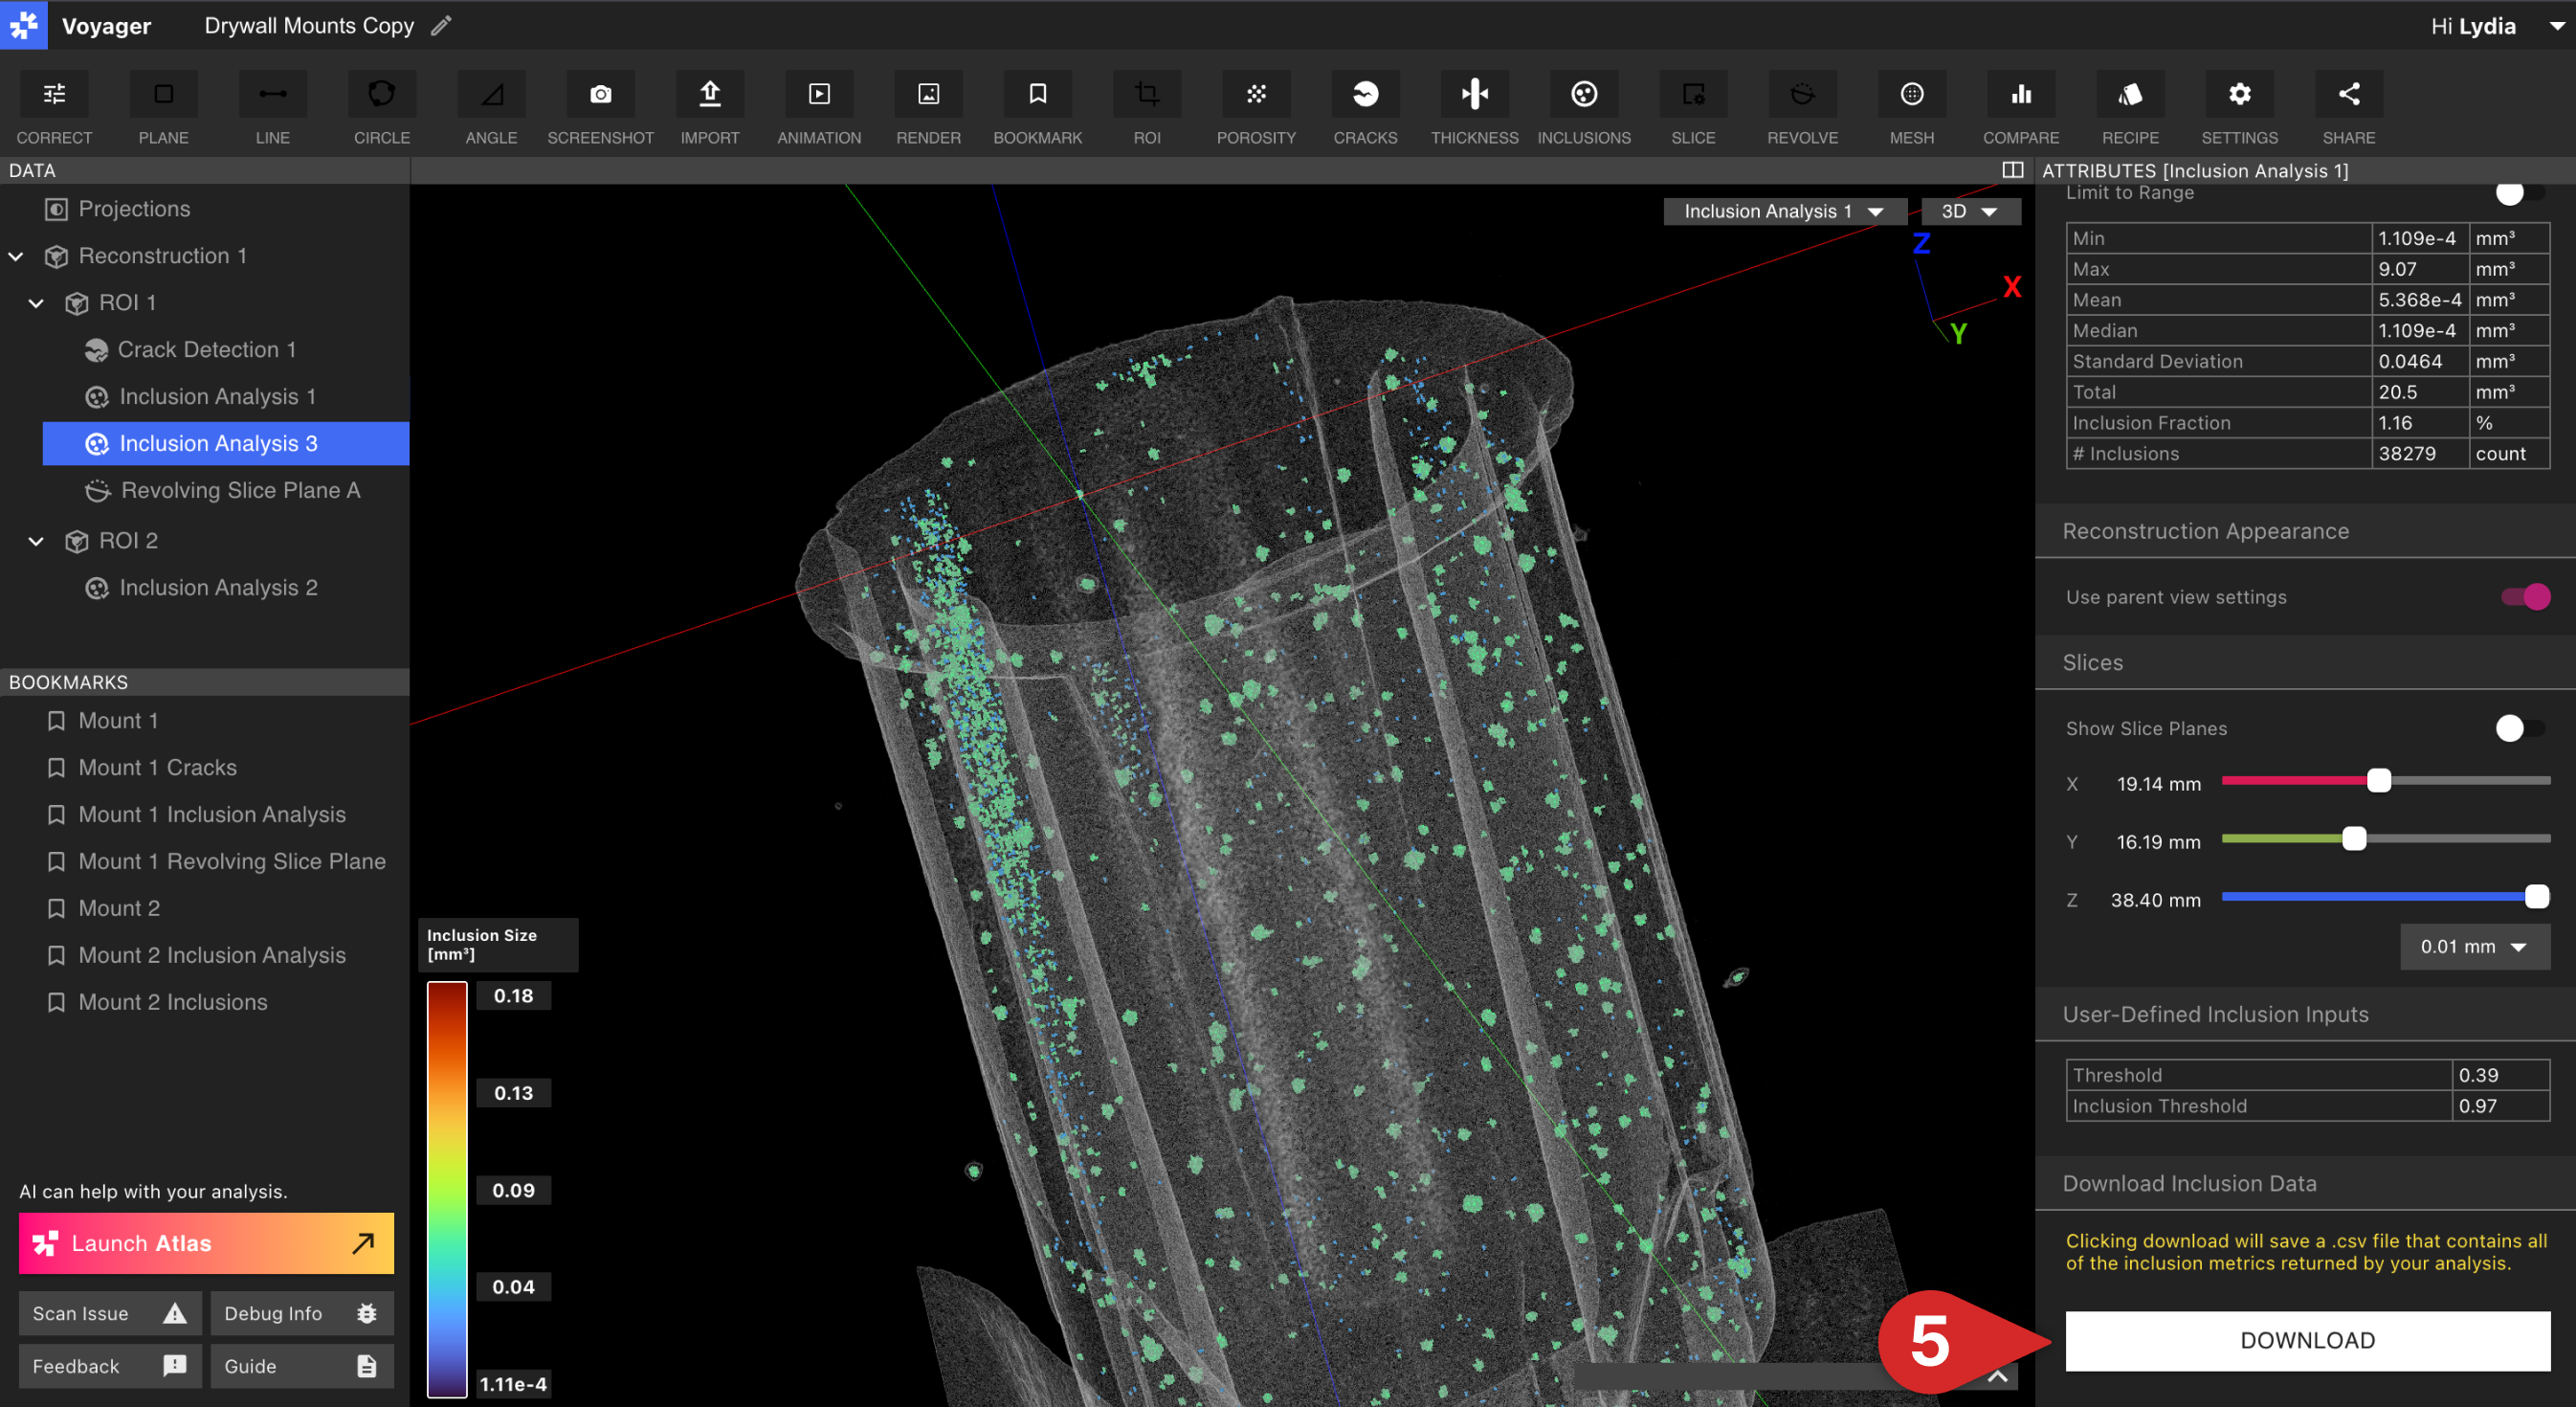
- Use the “Limit to Range” feature to update the bulk metrics to clip down to the selected range in the Data Map, and toggle back and forth to see how the selection compares to the global calculation.
- Click on Download if you want to download a .csv file with Inclusion results for further analysis.