Overview & Setup
To use Wall Thickness Analysis, ensure you have the Integrity Analysis module activated in your Organization.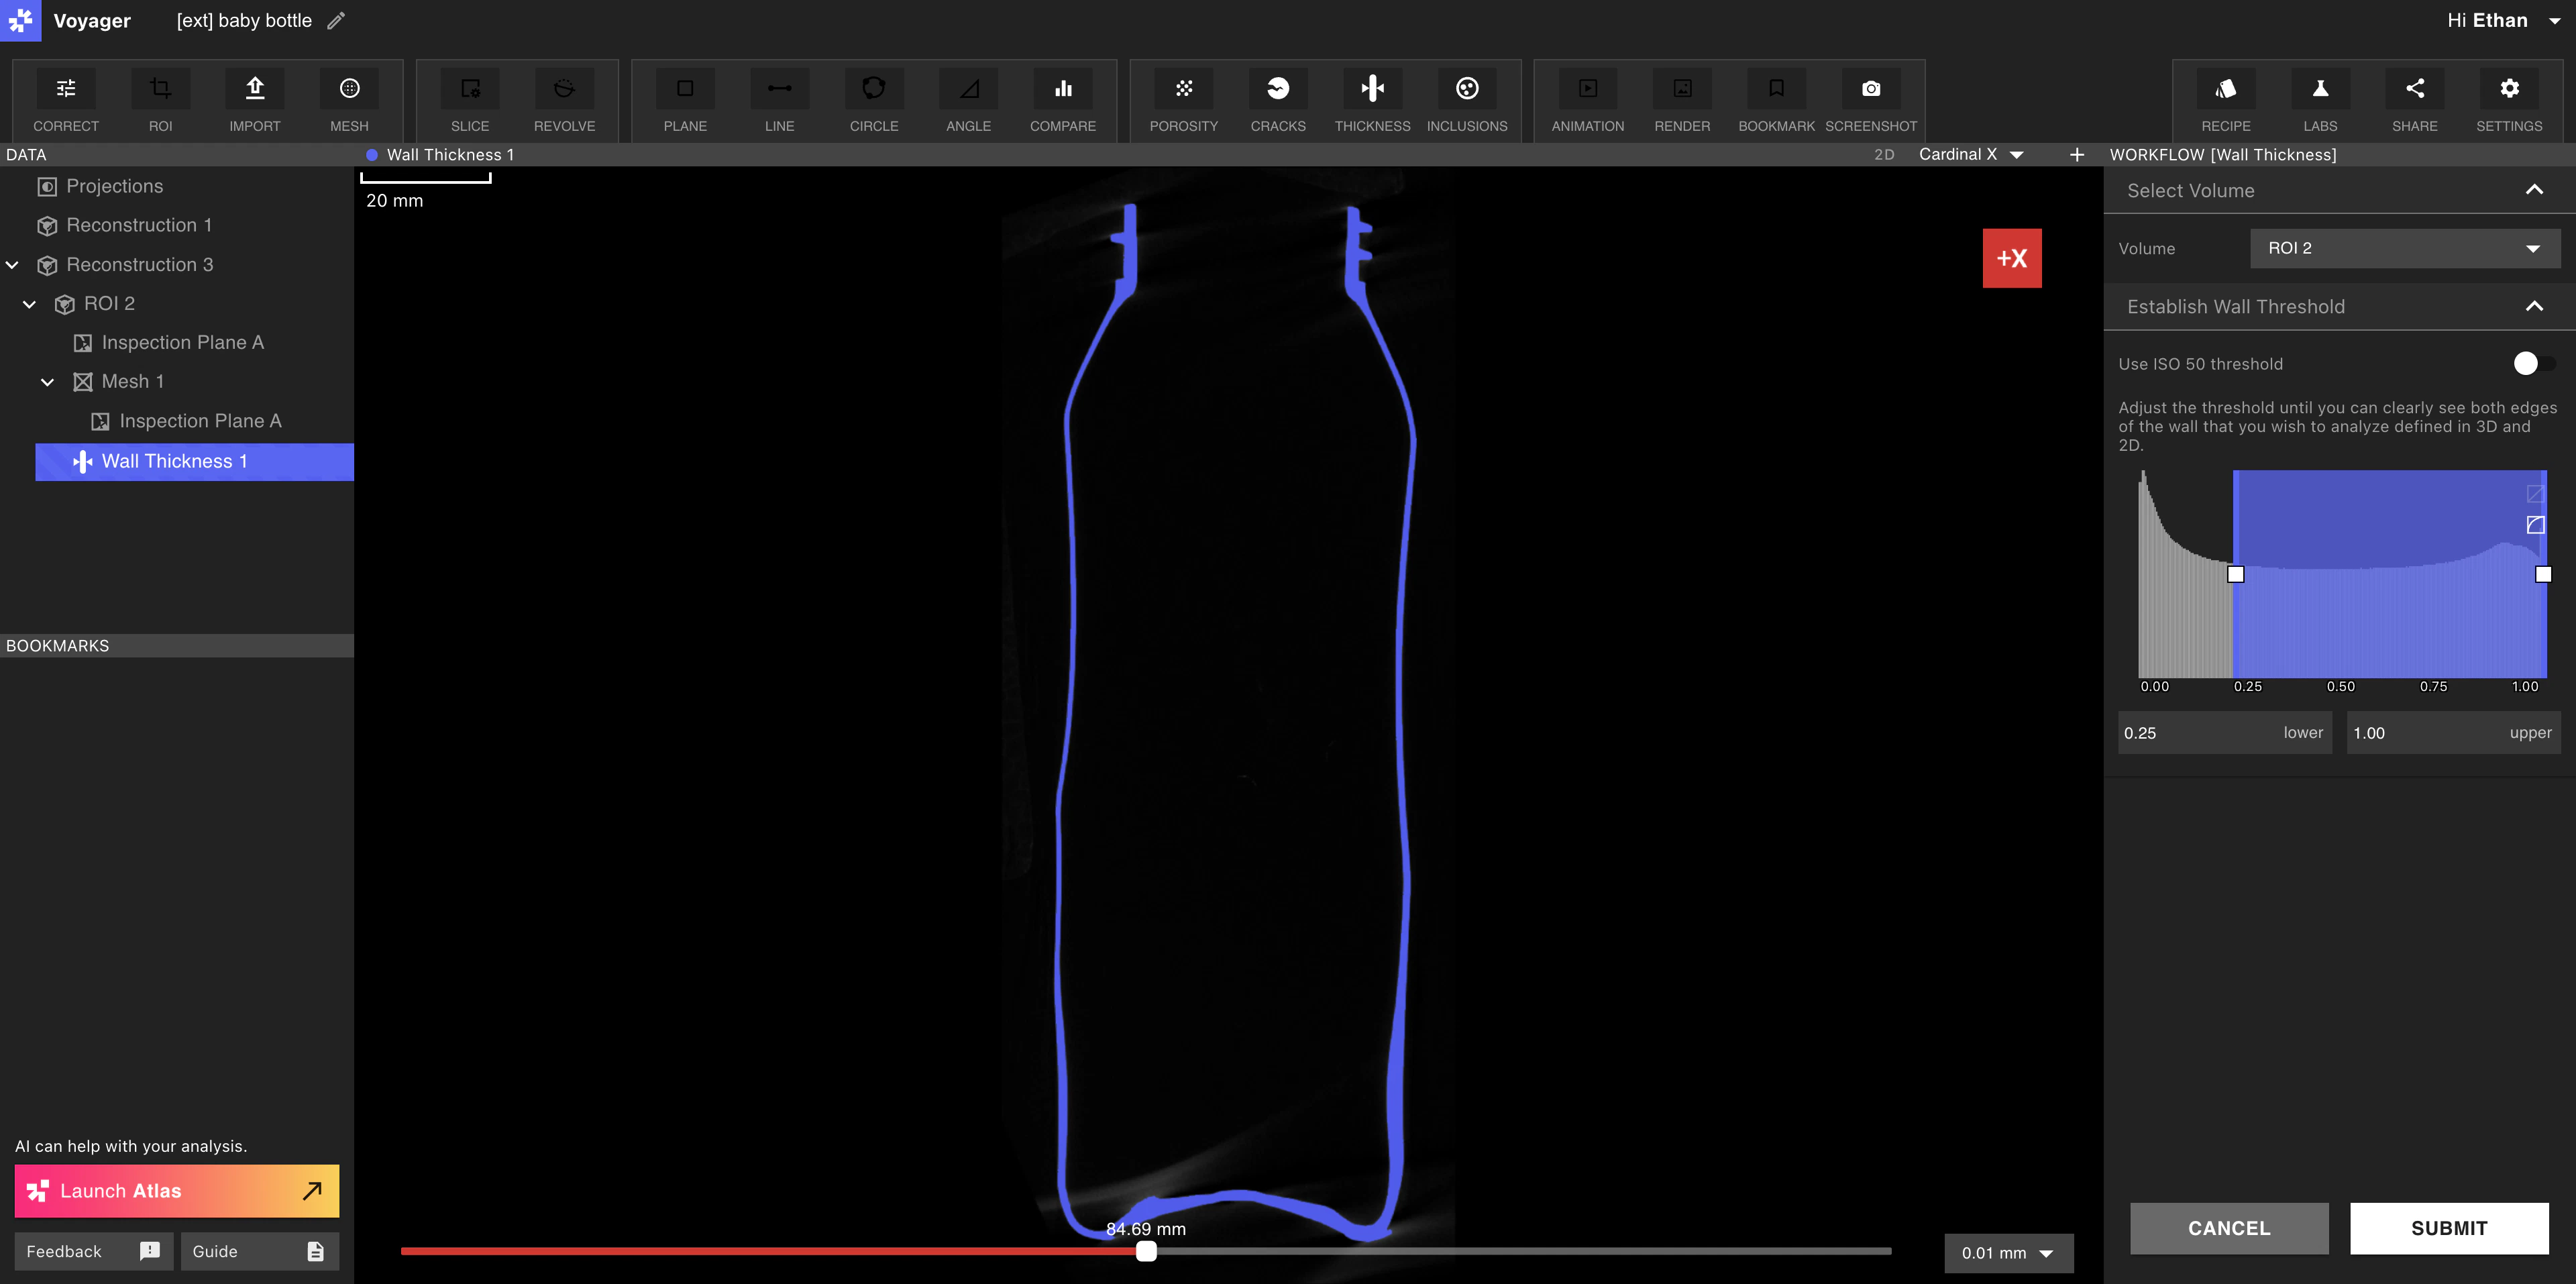

- Click on the “Wall Thickness Analysis” button in the Toolbar to begin the workflow.
- Select the volume you’d like to analyze. Note, you can run multiple Wall Thickness Analyses in parallel. The processing time for a given analysis depends on the number of voxels in your full resolution volume. We advise narrowing down your region of interest (ROI) in order to reduce the number of voxels required in the analysis. Running on a full volume can take well over an hour, similar to other simulations, like finite element analysis (FEA) or computational fluid dynamics (CFD).
- Adjust the Wall Threshold until you can clearly see both edges of the wall you wish to analyze in blue. If you’ve set the volume visualization to grayscale, the gray portion is the wall boundary in the scan. Matching the blue visualization to that boundary will provide you with the most accurate result. It is often most helpful to view the threshold in one of the 2D views. In a mono-material part, we typically recommend only adjusting the lower threshold. Increasing the lower threshold erodes more material from the analysis. Conversely, decreasing the lower threshold will include more material, increasing the relative wall thickness. For multi-material parts, adjusting the upper threshold can help isolate higher density materials in the analysis.
- Once you have set your threshold, click “Submit” to process the analysis on the Cloud.
Viewing & Analyzing Results
Once the analysis has run, to view the results, click on the Wall Thickness Analysis object in the “Data Panel” on the left. It will appear nested under its parent volume.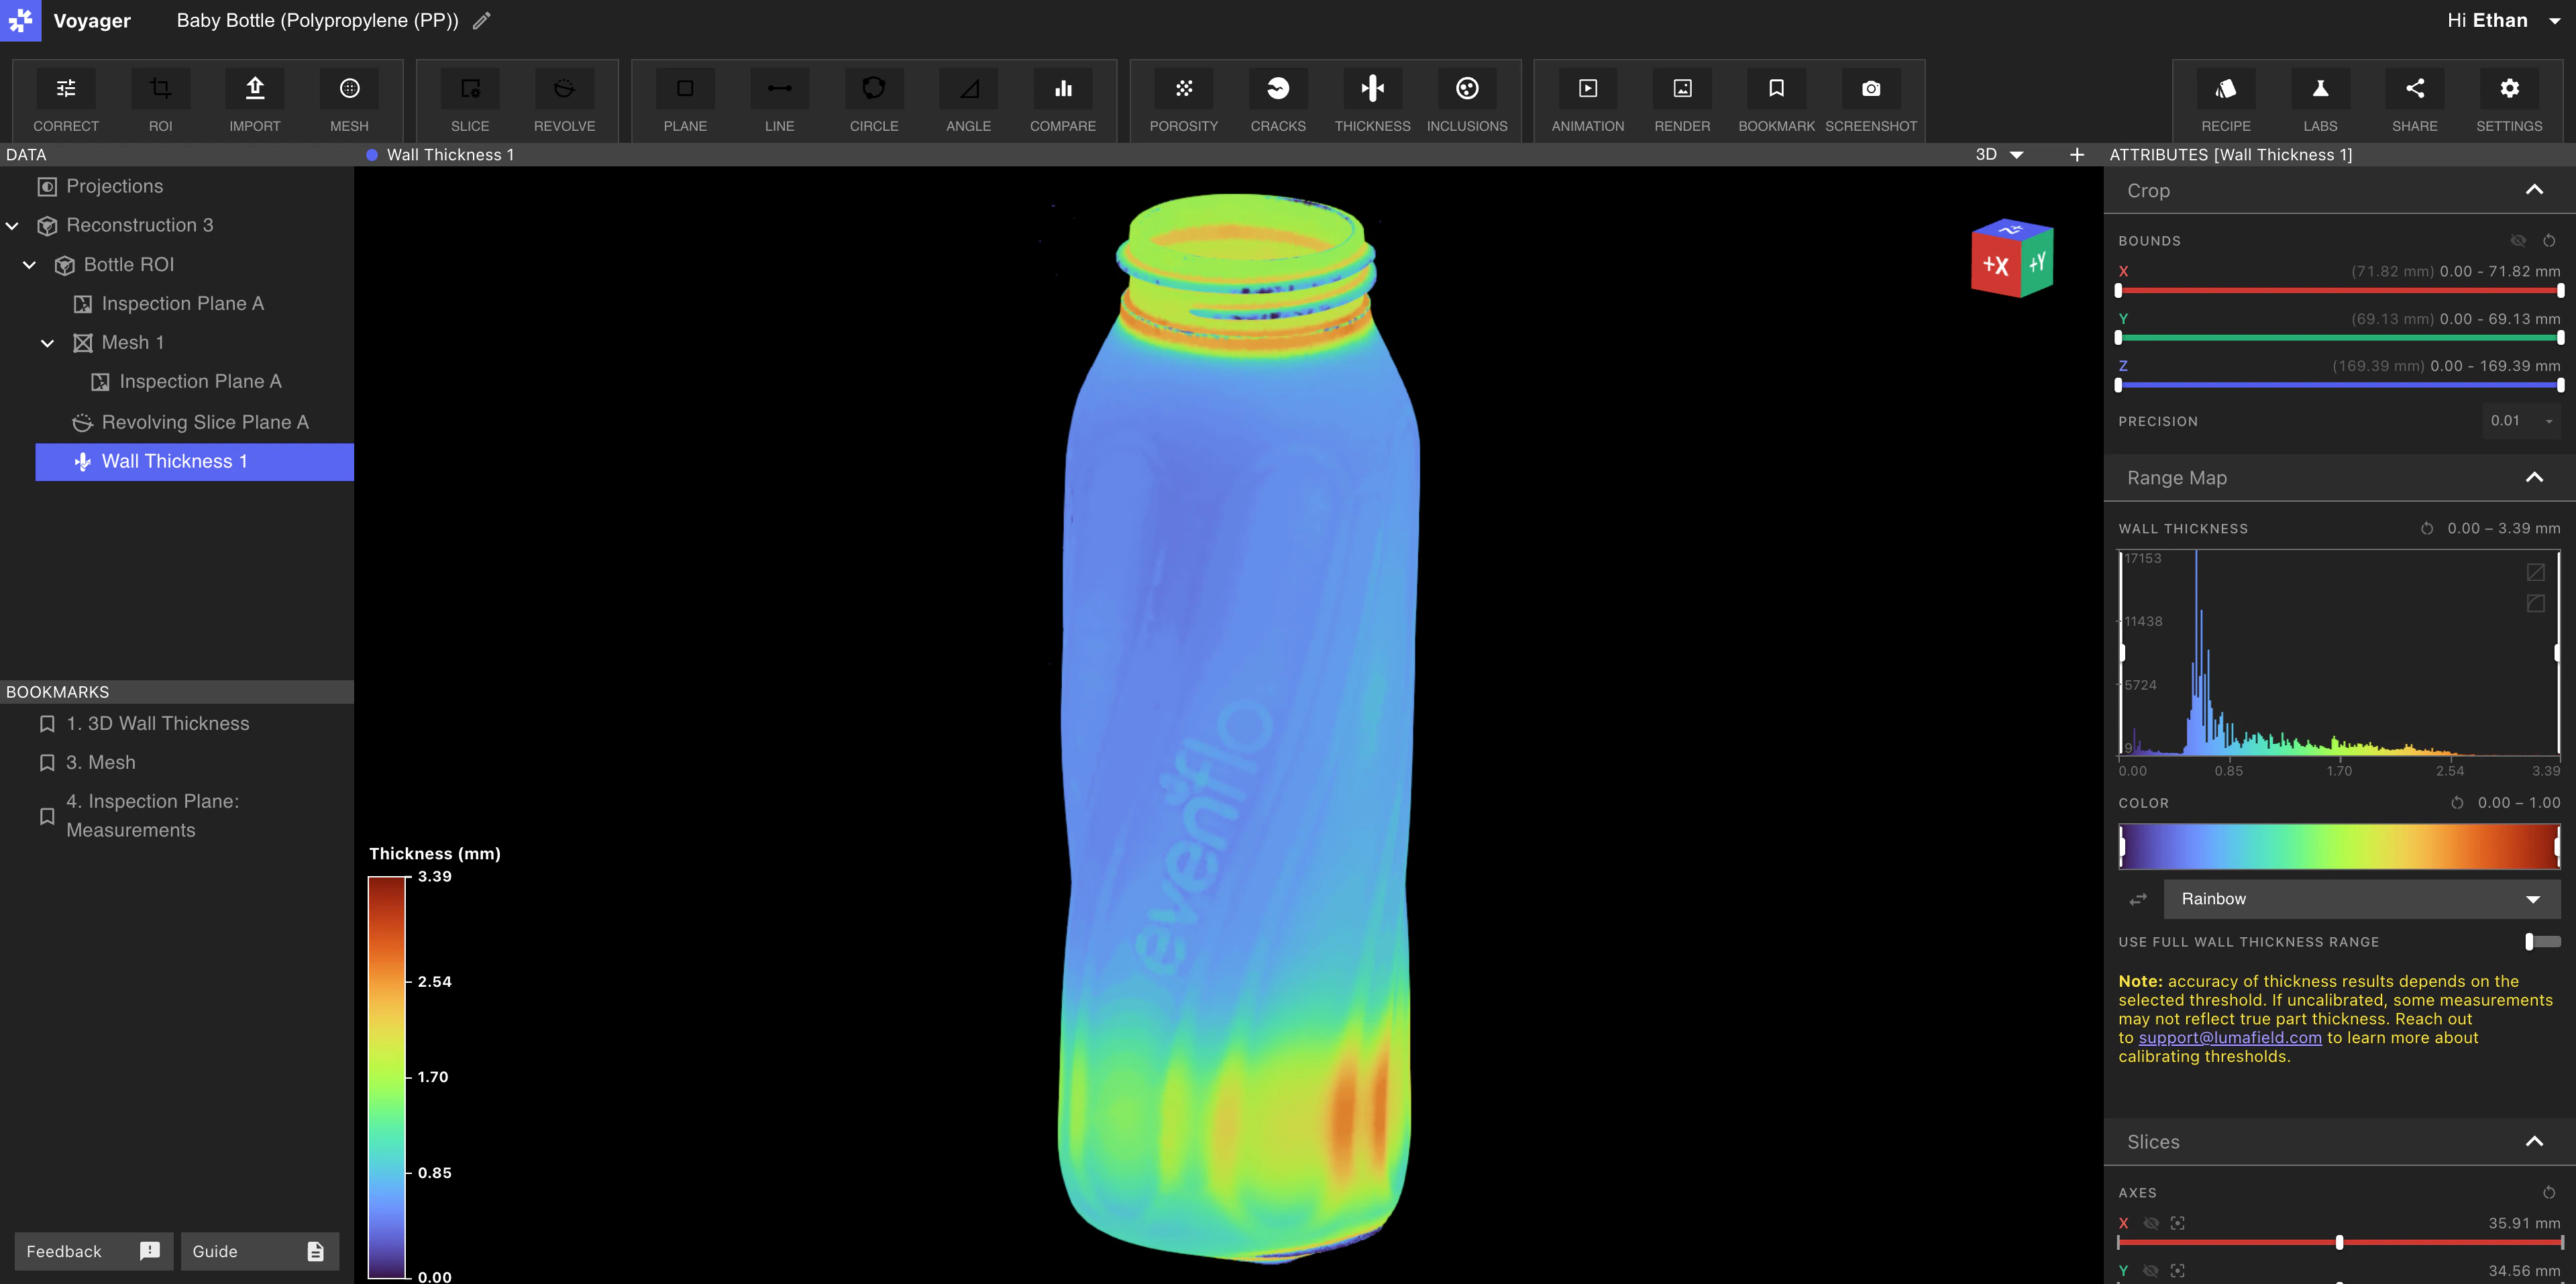
Using the Probe Tool
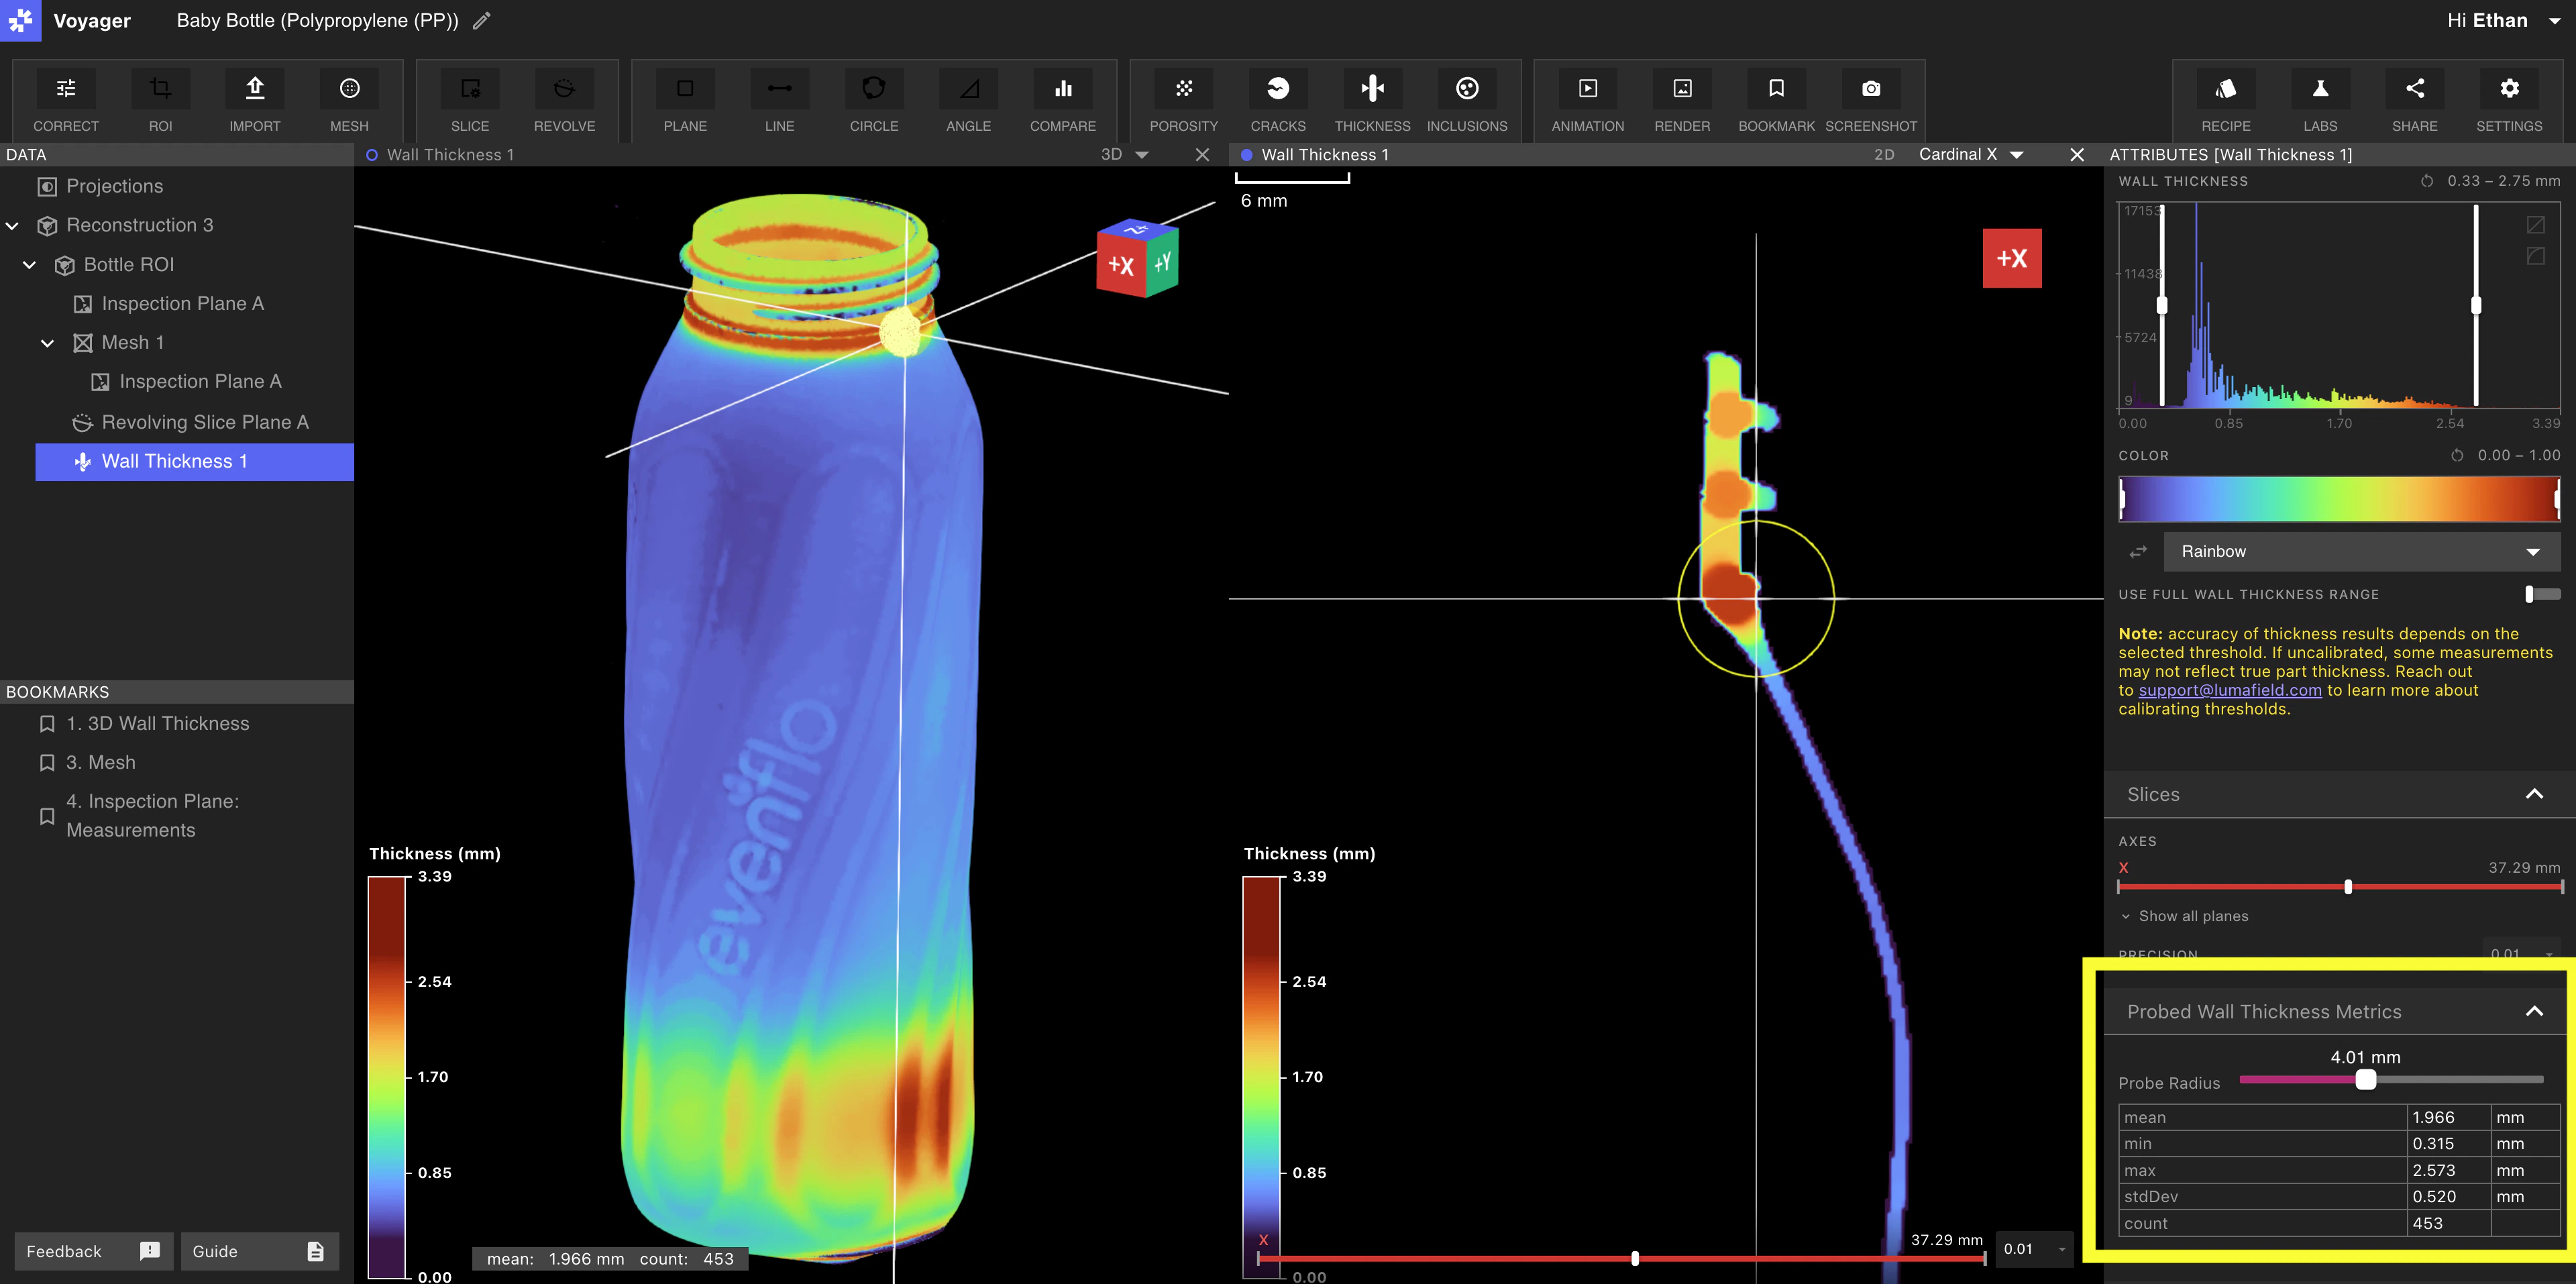
Supplementing visual wall thickness maps with probed point measurements can be helpful when comparing, calibrating, and sharing Analysis Results.
- Click on the 3D view of the Wall Thickness Analysis you want to probe.
- Left click on the point of interest to probe the area. The Probe Tool captures points in a sphere. You can adjust the probe radius by scrolling down to the “Probe Radius” slider in the Attributes Panel on the right. It will adjust in the Viewport in real-time. Note: 3D probe regions sync with the corresponding 2D slice in a split-screen view.
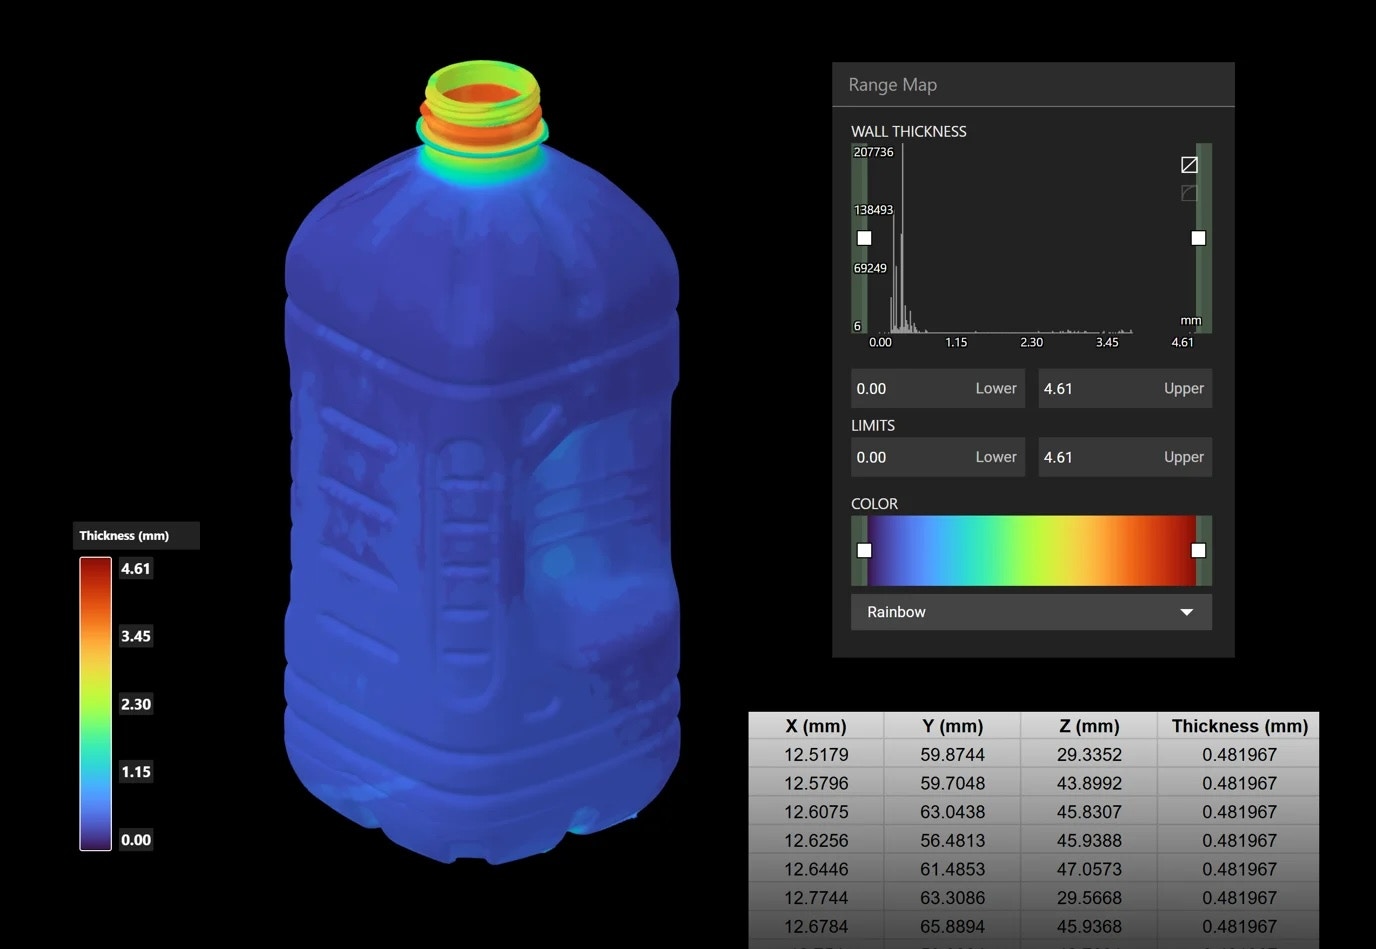
- View the measurements in the Attributes Panel. The Tool provides:
- Number of surfaces probed
- Minimum, maximum, mean, and standard deviation values for wall thicknesses
- The Viewport displays mean and surface counts
- To deactivate the Probe Tool, click in a space outside of the scan. Simply re-click a surface to reactivate it.
Downloading Results
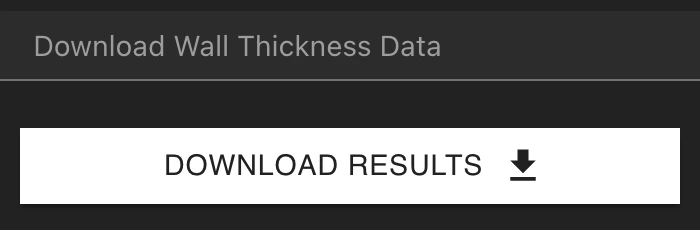
To download the resultant Mesh and wall thickness results, scroll down in the “Attributes Panel” and click “download”. The Mesh file (.PLY) and down-sampled CSV of the Mesh vertices (x, y, z coordinates) and corresponding thickness results will be downloaded.