> ## Documentation Index
> Fetch the complete documentation index at: https://support.lumafield.com/llms.txt
> Use this file to discover all available pages before exploring further.

# 比較工具

> 量化和視覺化掃描與 CAD 模型之間或兩次掃描之間的偏差

<h2 id="summary">
  概括
</h2>

比較工具是 Voyager 中的多功能且強大的分析功能，可用於評估各種應用中的整體尺寸偏差。例如：

1. 將零件的掃描與用於使其了解全局和局部尺寸偏差的 CAD 模型進行比較。
2. 比較同一零件的兩次掃描，以表徵隨時間推移的磨損情況或加速壽命測試的影響。
3. 比較同一零件的不同實例，以量化射出成型模具型腔之間的差異或不同供應商之間的差異。

<h2 id="preparing-your-cad-or-nominal-mesh">
  準備 CAD（或標稱）網格
</h2>

**標稱網格**代表設計意圖（在將掃描與 CAD 進行比較的情況下），或代表您想要與分析網格進行比較的狀態（例如，在磨損測試的情況下使用之前）。

如果從 CAD 工具建立名義網格：

<Steps>
  <Step title="隔離您的零件">
    在 CAD 工具中，隔離要用於分析的主體。
  </Step>

  <Step title="將主體匯出為 STL">
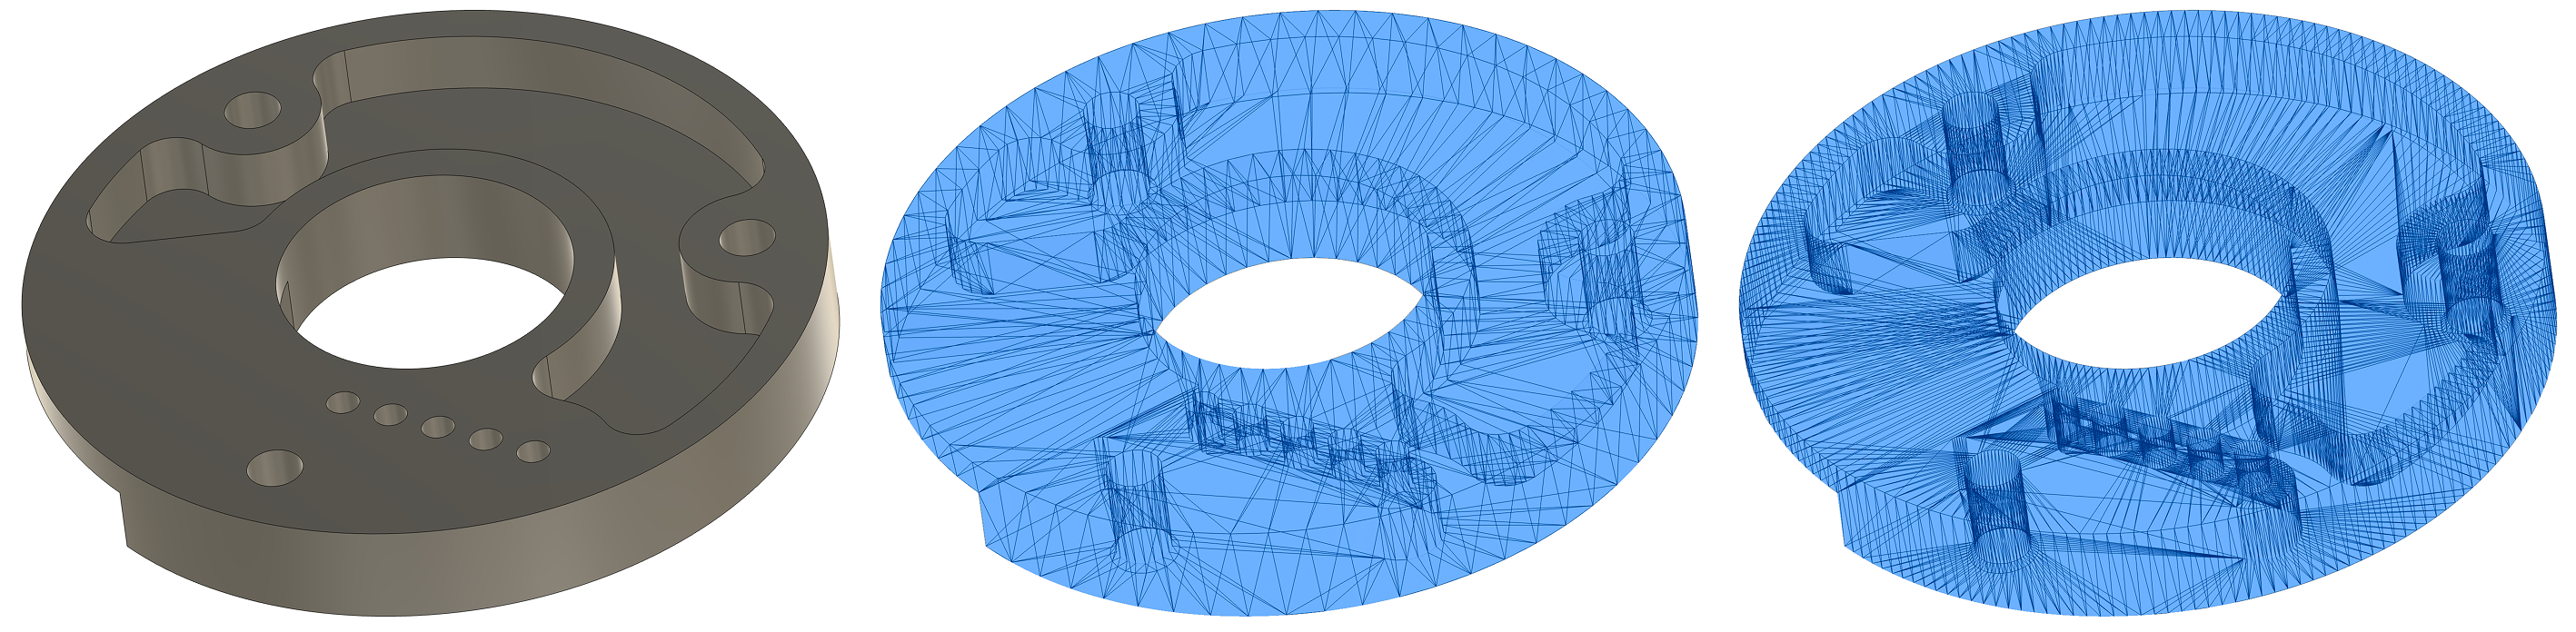
    確保網格包含足夠的多邊形以正確解析曲線。  匯出 CAD 模型時，CAD 工具通常預設為低多邊形數（左） - 中間影像顯示低多邊形數，而右圖顯示足夠高的多邊形數。  如果您可以存取 CAD 工具中的網格生成參數，請將「表面偏差」設定為 0.001 毫米或更低的值。  這將減少 CAD 模型細分所產生的錯誤。
    <img height="200" src="https://mintcdn.com/lumafield/iD2sgKuz7BoMpq7k/images/comparison-mesh-poly-count.png?fit=max&auto=format&n=iD2sgKuz7BoMpq7k&q=85&s=65a8dbe739c6bd5bb0fb216e3e711450" data-path="images/comparison-mesh-poly-count.png" />
  </Step>

  <Step title="將 STL 匯入您的 Voyager 專案">
    請務必將單位設定為與匯出的 CAD 工具中使用的單位相同。

    <Frame>
      <img src="https://mintcdn.com/lumafield/m5QGN5HaY0IKqsU9/images/Compare_Import_Icon.png?fit=max&auto=format&n=m5QGN5HaY0IKqsU9&q=85&s=e781f67330e7e0402f75a1e01fce444c" alt="比對圖示" width="1610" height="366" data-path="images/Compare_Import_Icon.png" />
    </Frame>
  </Step>
</Steps>

<h2 id="preparing-your-analysis-mesh">
  準備分析網格
</h2>

**分析網格**或**要分析的網格**是您想要表徵的網格。  通常，此網格是使用 Voyager 的 [網格工具](/zh-Hant/voyager/voyager-mesh-tool) 在 Voyager 中根據 CT 掃描資料產生的。  來自第三方掃描器（如結構光掃描器）的網格也可以匯入並用作分析網格。

<h2 id="running-the-workflow">
  運行工作流程
</h2>

<Steps>
  <Step title="在工具列中選擇「比較」按鈕">
    <img height="200" className="hidden dark:block" src="https://mintcdn.com/lumafield/iD2sgKuz7BoMpq7k/images/comparison-click-compare.png?fit=max&auto=format&n=iD2sgKuz7BoMpq7k&q=85&s=97e16e742c3bddb9b148468249625dd3" data-path="images/comparison-click-compare.png" />

    <img height="200" className="dark:hidden" src="https://mintcdn.com/lumafield/m5QGN5HaY0IKqsU9/images/Compare_Compare_Icon.png?fit=max&auto=format&n=m5QGN5HaY0IKqsU9&q=85&s=36bac413fd767c4c6f7e5123cb724ae1" data-path="images/Compare_Compare_Icon.png" />
  </Step>

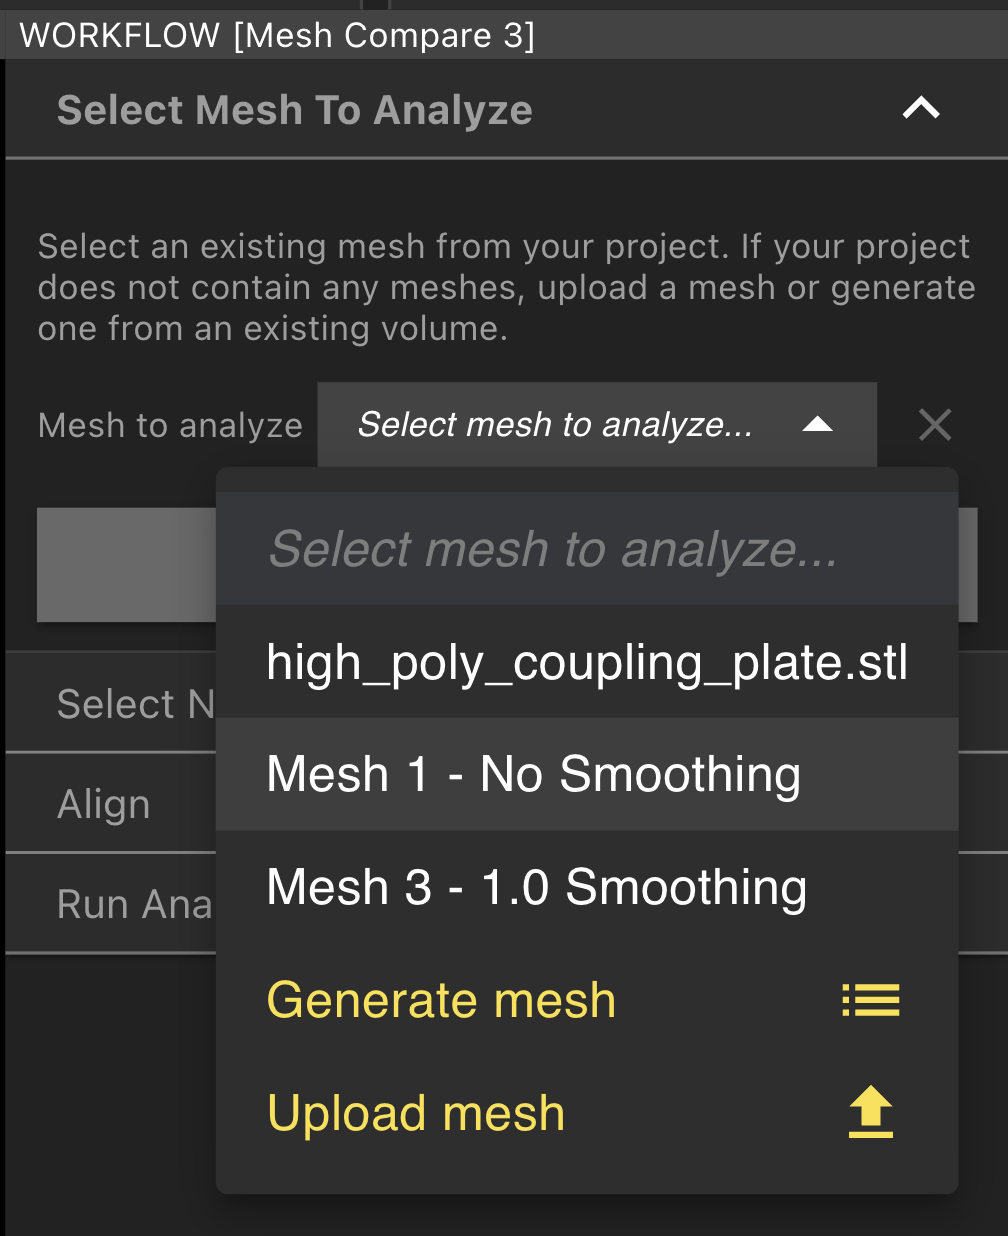
  <Step title="選擇您要分析的網格">
    <Frame>
      <img src="https://mintcdn.com/lumafield/m5QGN5HaY0IKqsU9/images/Compare_Mesh_To_Analyze.png?fit=max&auto=format&n=m5QGN5HaY0IKqsU9&q=85&s=0feb71fa848509c45c72a168eef40c02" alt="Compare Mesh To Analyze" title="Compare Mesh To Analyze" style={{ width:"40%" }} width="1008" height="1236" data-path="images/Compare_Mesh_To_Analyze.png" />
    </Frame>
  </Step>

  <Step title="選擇您的標稱網格">
    <Frame>
      <img src="https://mintcdn.com/lumafield/m5QGN5HaY0IKqsU9/images/Compare_Nominal_Mesh.png?fit=max&auto=format&n=m5QGN5HaY0IKqsU9&q=85&s=c7fdcf8da333963da1920dcf78ff7ab7" alt="Compare Nominal Mesh" style={{ width:"40%" }} width="1020" height="1234" data-path="images/Compare_Nominal_Mesh.png" />
    </Frame>
  </Step>

  <Step title="粗略對齊網格">
    使用 Viewport 中的旋轉手柄，旋轉分析網格，直到其與標稱網格大致對齊。  這不一定是完美的，因為我們接下來將運行精細的自動對齊以更精確地對齊兩個網格。

    <video src="https://mintcdn.com/lumafield/m5QGN5HaY0IKqsU9/images/Compare_Coarse_Align.mp4?fit=max&auto=format&n=m5QGN5HaY0IKqsU9&q=85&s=e9a19eaed3adc62adf293508e9dba08b" controls={true} data-path="images/Compare_Coarse_Align.mp4" />
  </Step>

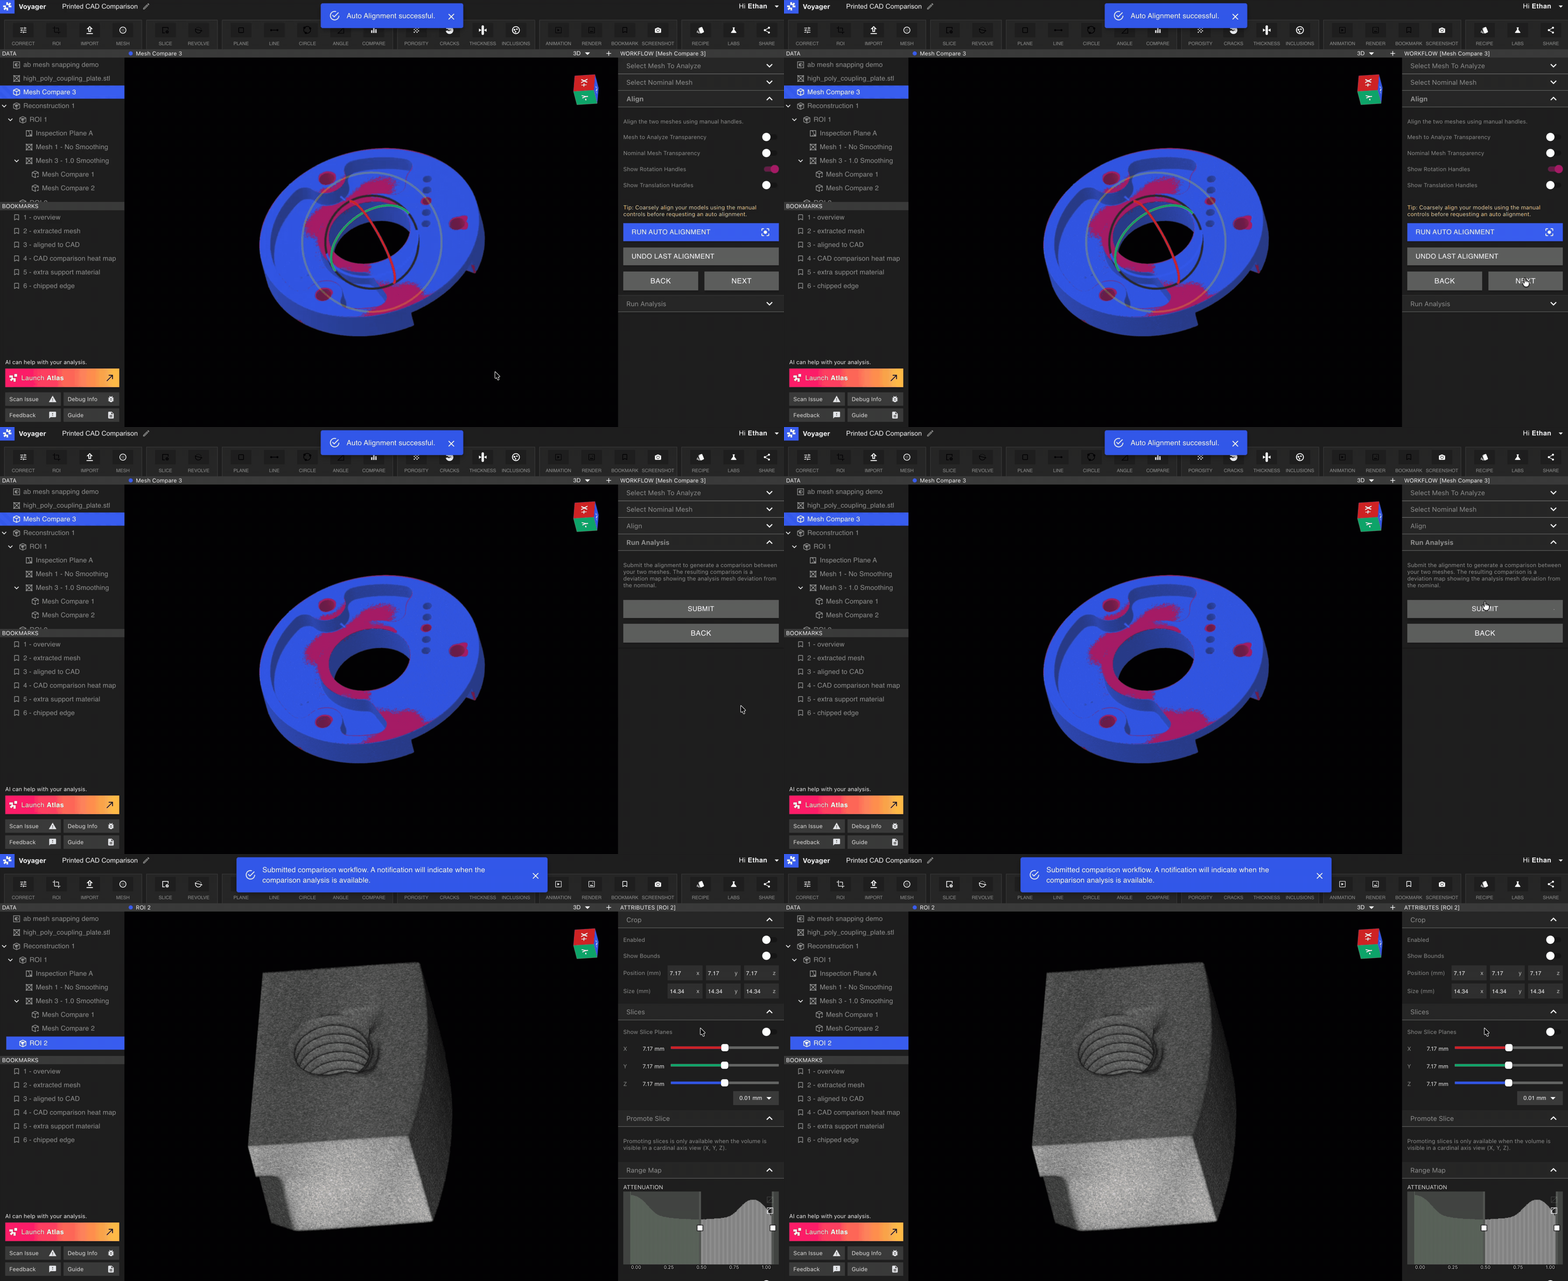
  <Step title="執行自動對齊">
    自動對齊執行全域最佳擬合對齊。  當零件之間的偏差較小時，此方法效果很好，但如果零件之間存在較大差異，或與特定特徵或資料對齊​​很重要，則可能需要進行一些手動調整。

    <video src="https://mintcdn.com/lumafield/m5QGN5HaY0IKqsU9/images/Compare_Auto_Align.mp4?fit=max&auto=format&n=m5QGN5HaY0IKqsU9&q=85&s=c5884a9a4ac80f8af4eca2d838d6bd54" controls={true} data-path="images/Compare_Auto_Align.mp4" />
  </Step>

  <Step title="提交比較">
    一旦您對對齊感到滿意，請點擊「提交」將分析發送到 Lumafield Cloud 進行計算。  通常 1-10 分鐘內即可獲得結果。
    <Frame>
      <img src="https://mintcdn.com/lumafield/m5QGN5HaY0IKqsU9/images/Compare_Submit.gif?s=7bcb7747c6b7db4f63c53fa089d53236" alt="提交比對" width="3024" height="1650" data-path="images/Compare_Submit.gif" />
    </Frame>
  </Step>
</Steps>

<h2 id="visualizing-and-interpreting-results">
  可視化和解釋結果
</h2>

<h3 id="3d">
  3D
</h3>

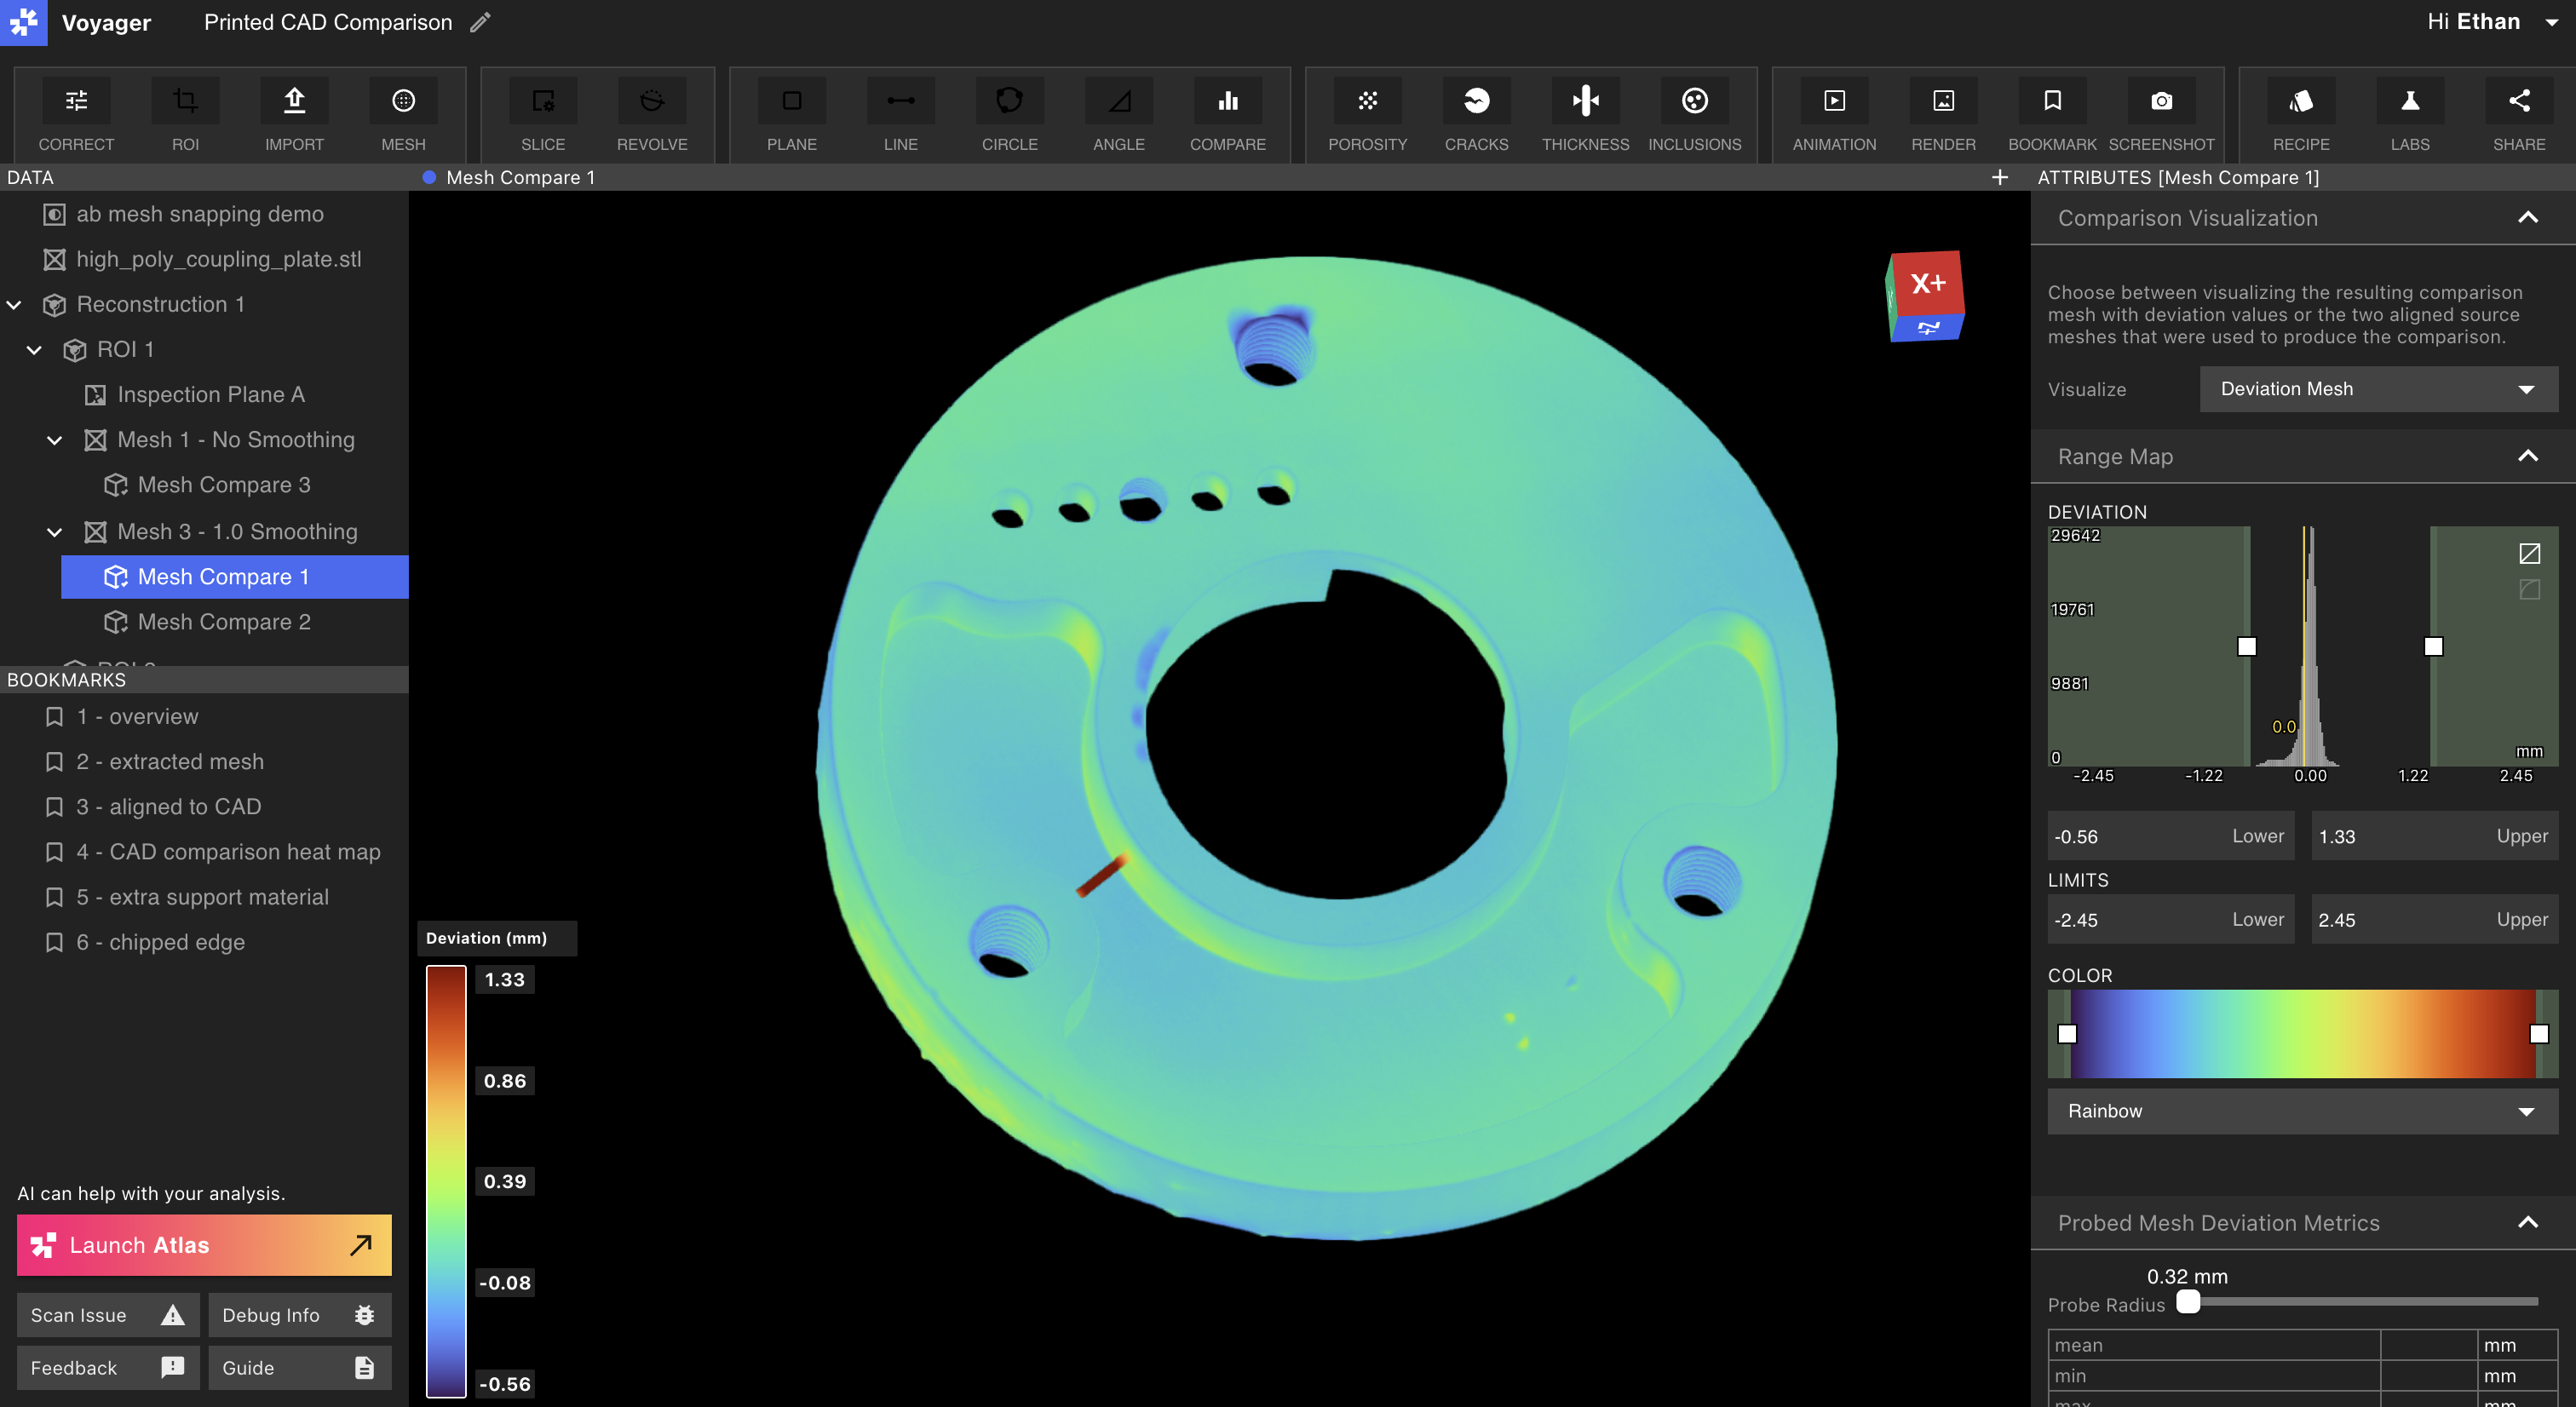
比較工具將分析網格和標稱網格之間的偏差映射到分析網格上，並顯示熱圖視覺化。  紅色對應於正偏差，表示分析網格偏離標稱網格的區域。藍色對應於具有負偏差的區域，即相對於標稱網格不存在材料。

<Frame>
  <img src="https://mintcdn.com/lumafield/m5QGN5HaY0IKqsU9/images/Compare_3D.png?fit=max&auto=format&n=m5QGN5HaY0IKqsU9&q=85&s=49bb17af51872e35ff12078b18bc3038" alt="比對 3D" width="3024" height="1652" data-path="images/Compare_3D.png" />
</Frame>

<h3 id="probe-tool">
  探針工具
</h3>

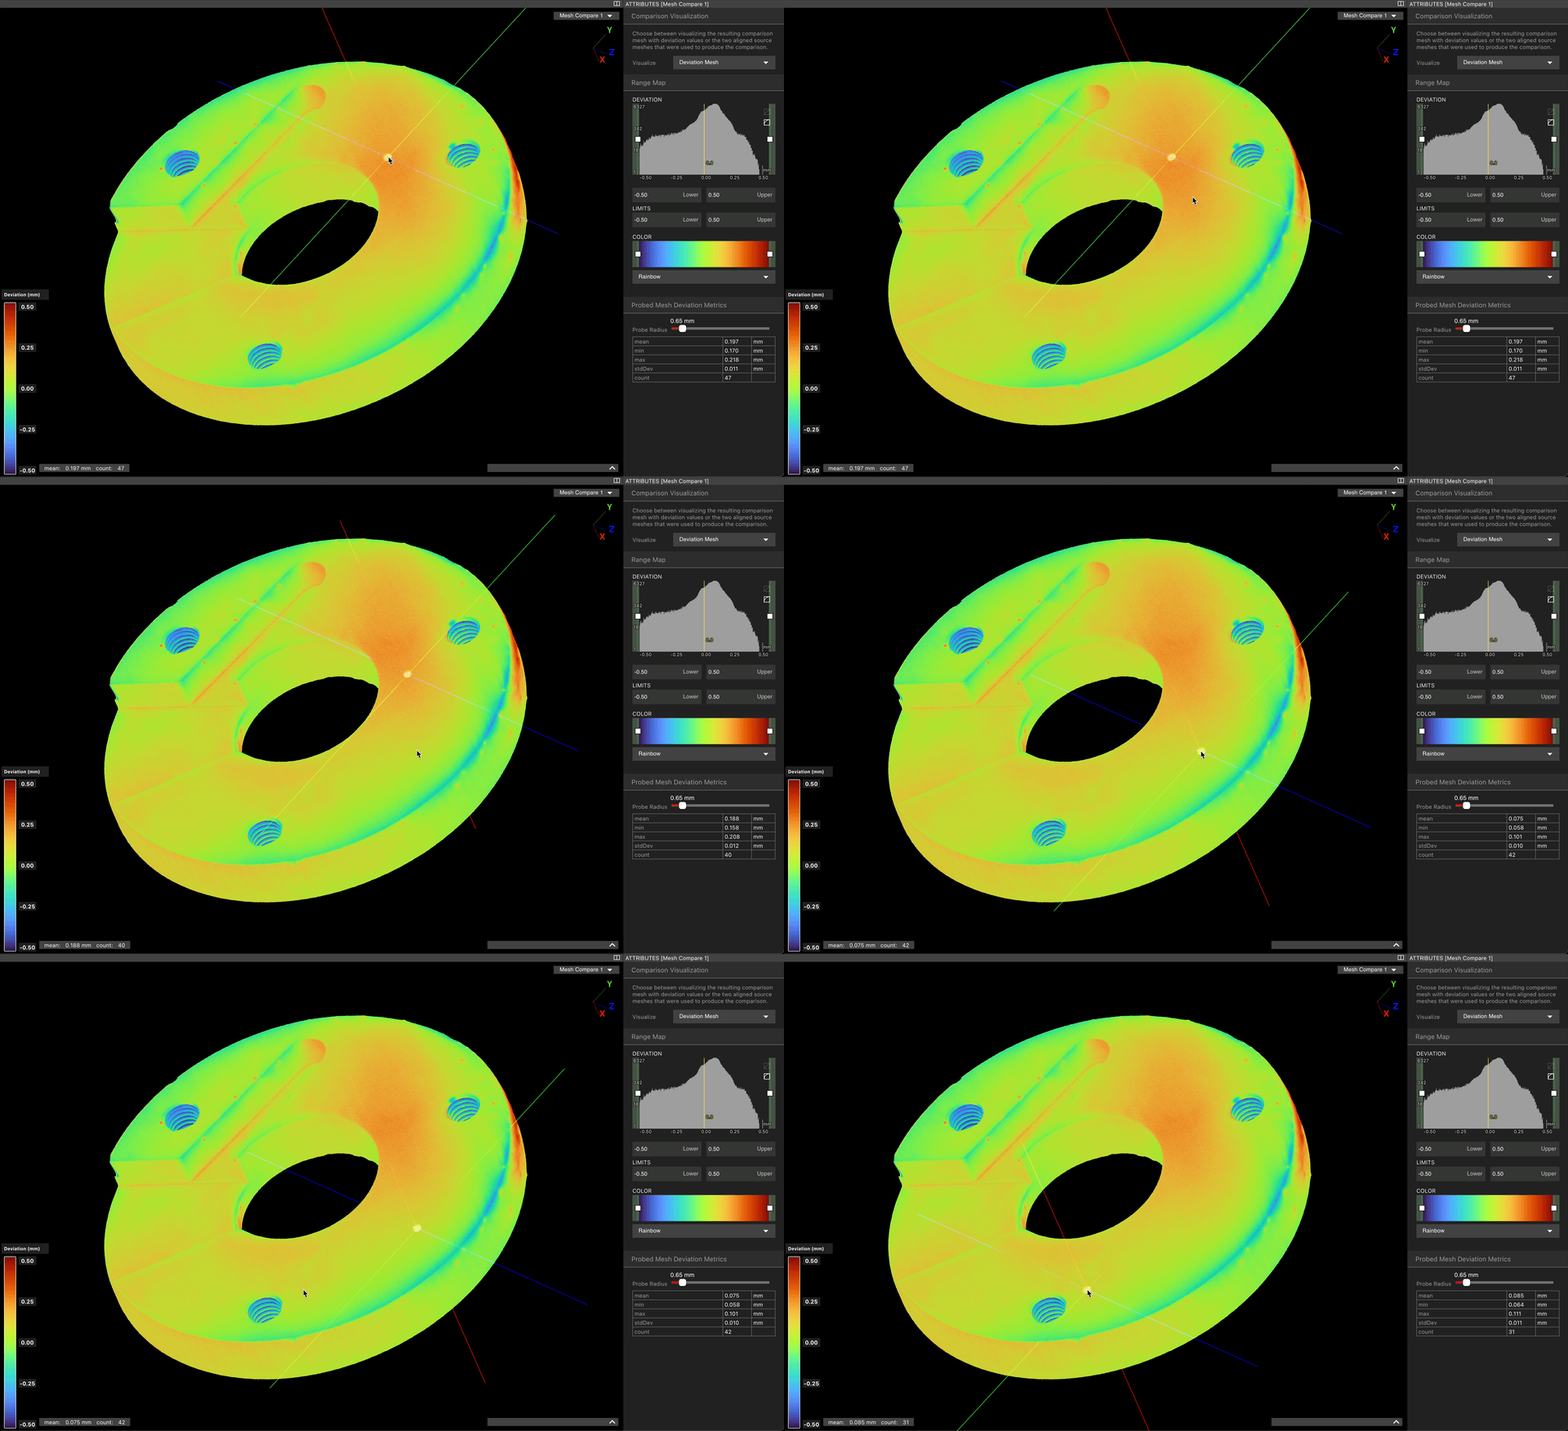
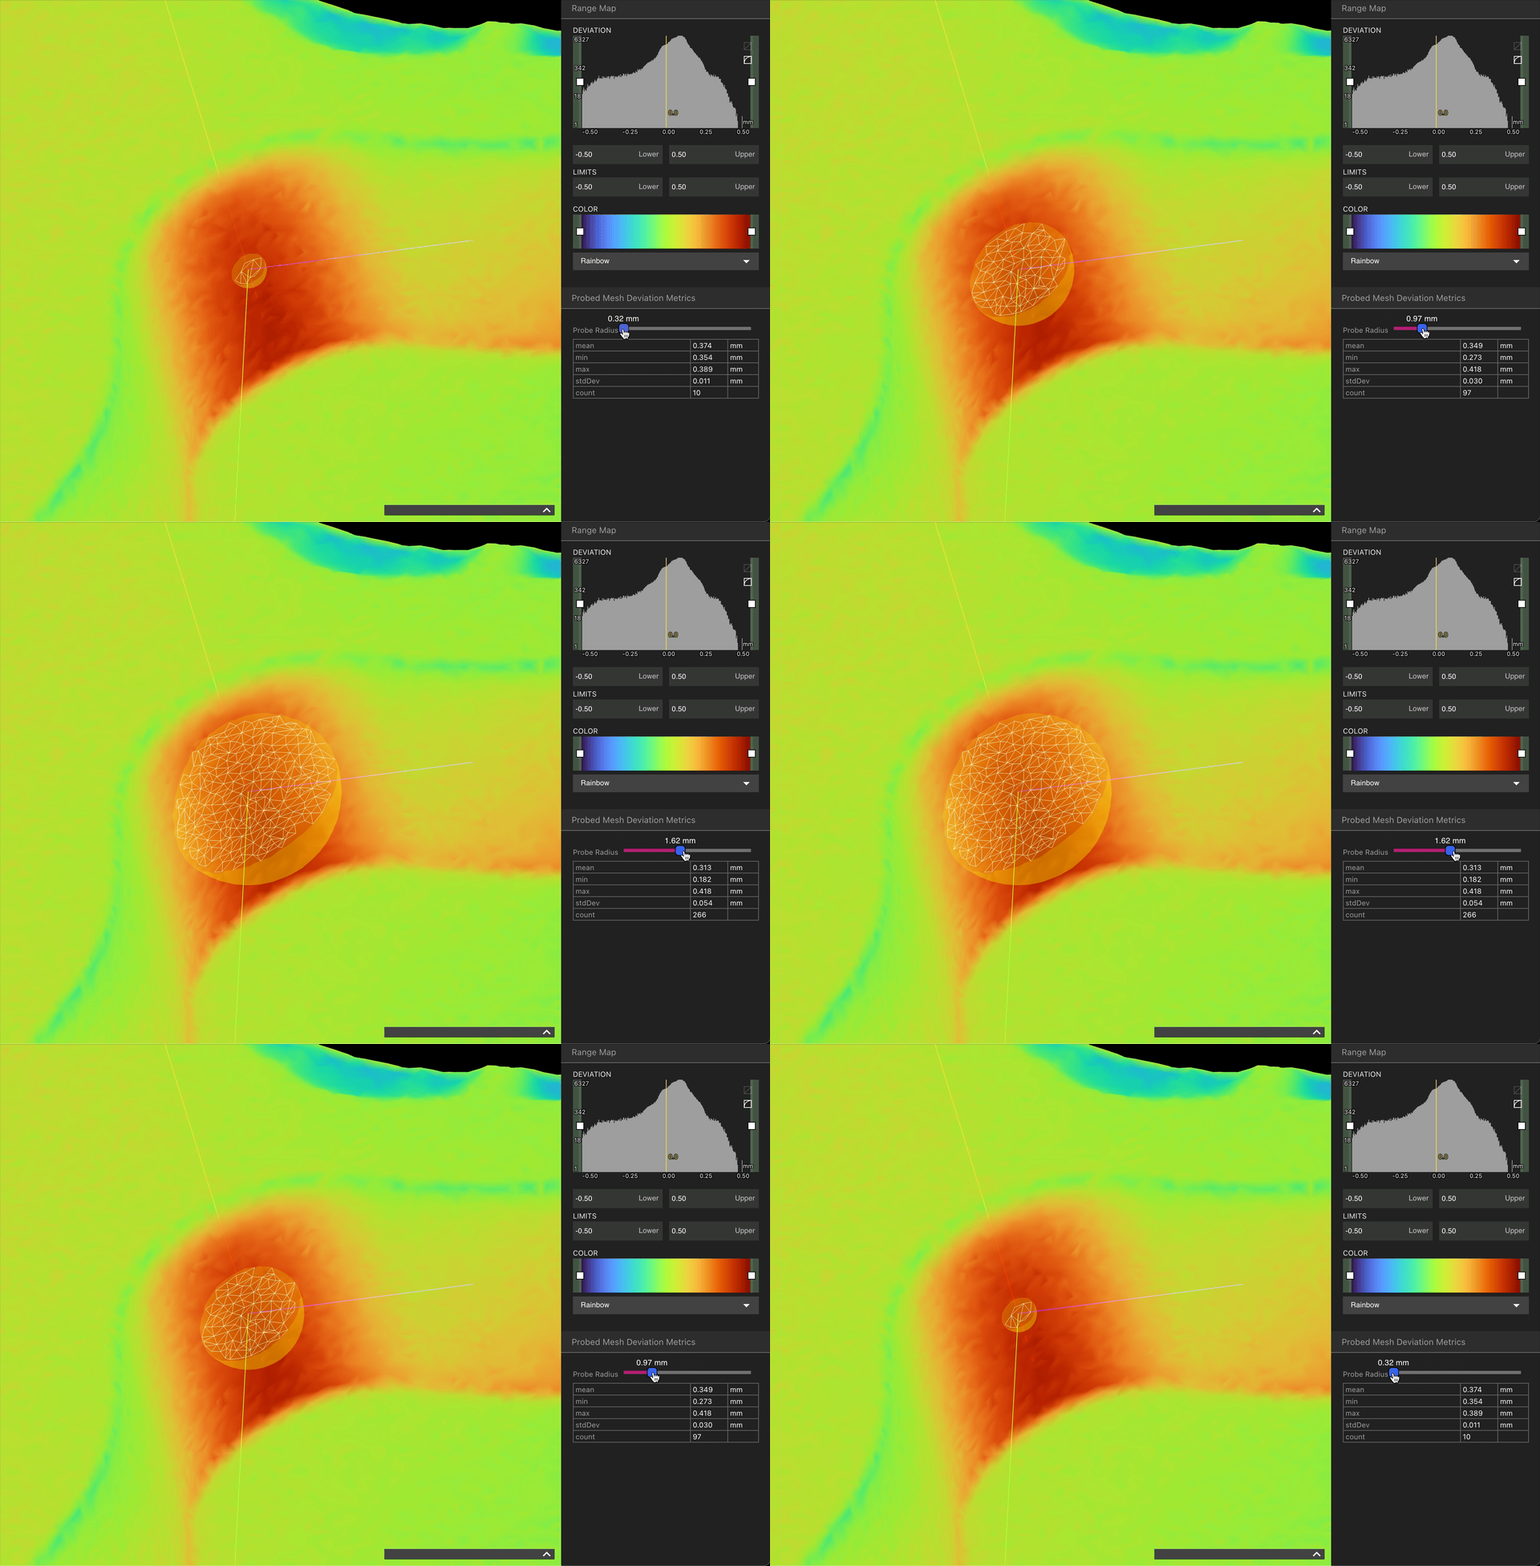
點擊比較分析結果上的任意位置將啟動探測工具，測量該位置的偏差。平均偏差和探頭採樣的多邊形數量顯示在左下角靠近色條的位置。

<img height="200" src="https://mintcdn.com/lumafield/iD2sgKuz7BoMpq7k/images/comparison-probe-tool.gif?s=f24ef2e5c7a08094960c449150b81c32" data-path="images/comparison-probe-tool.gif" />

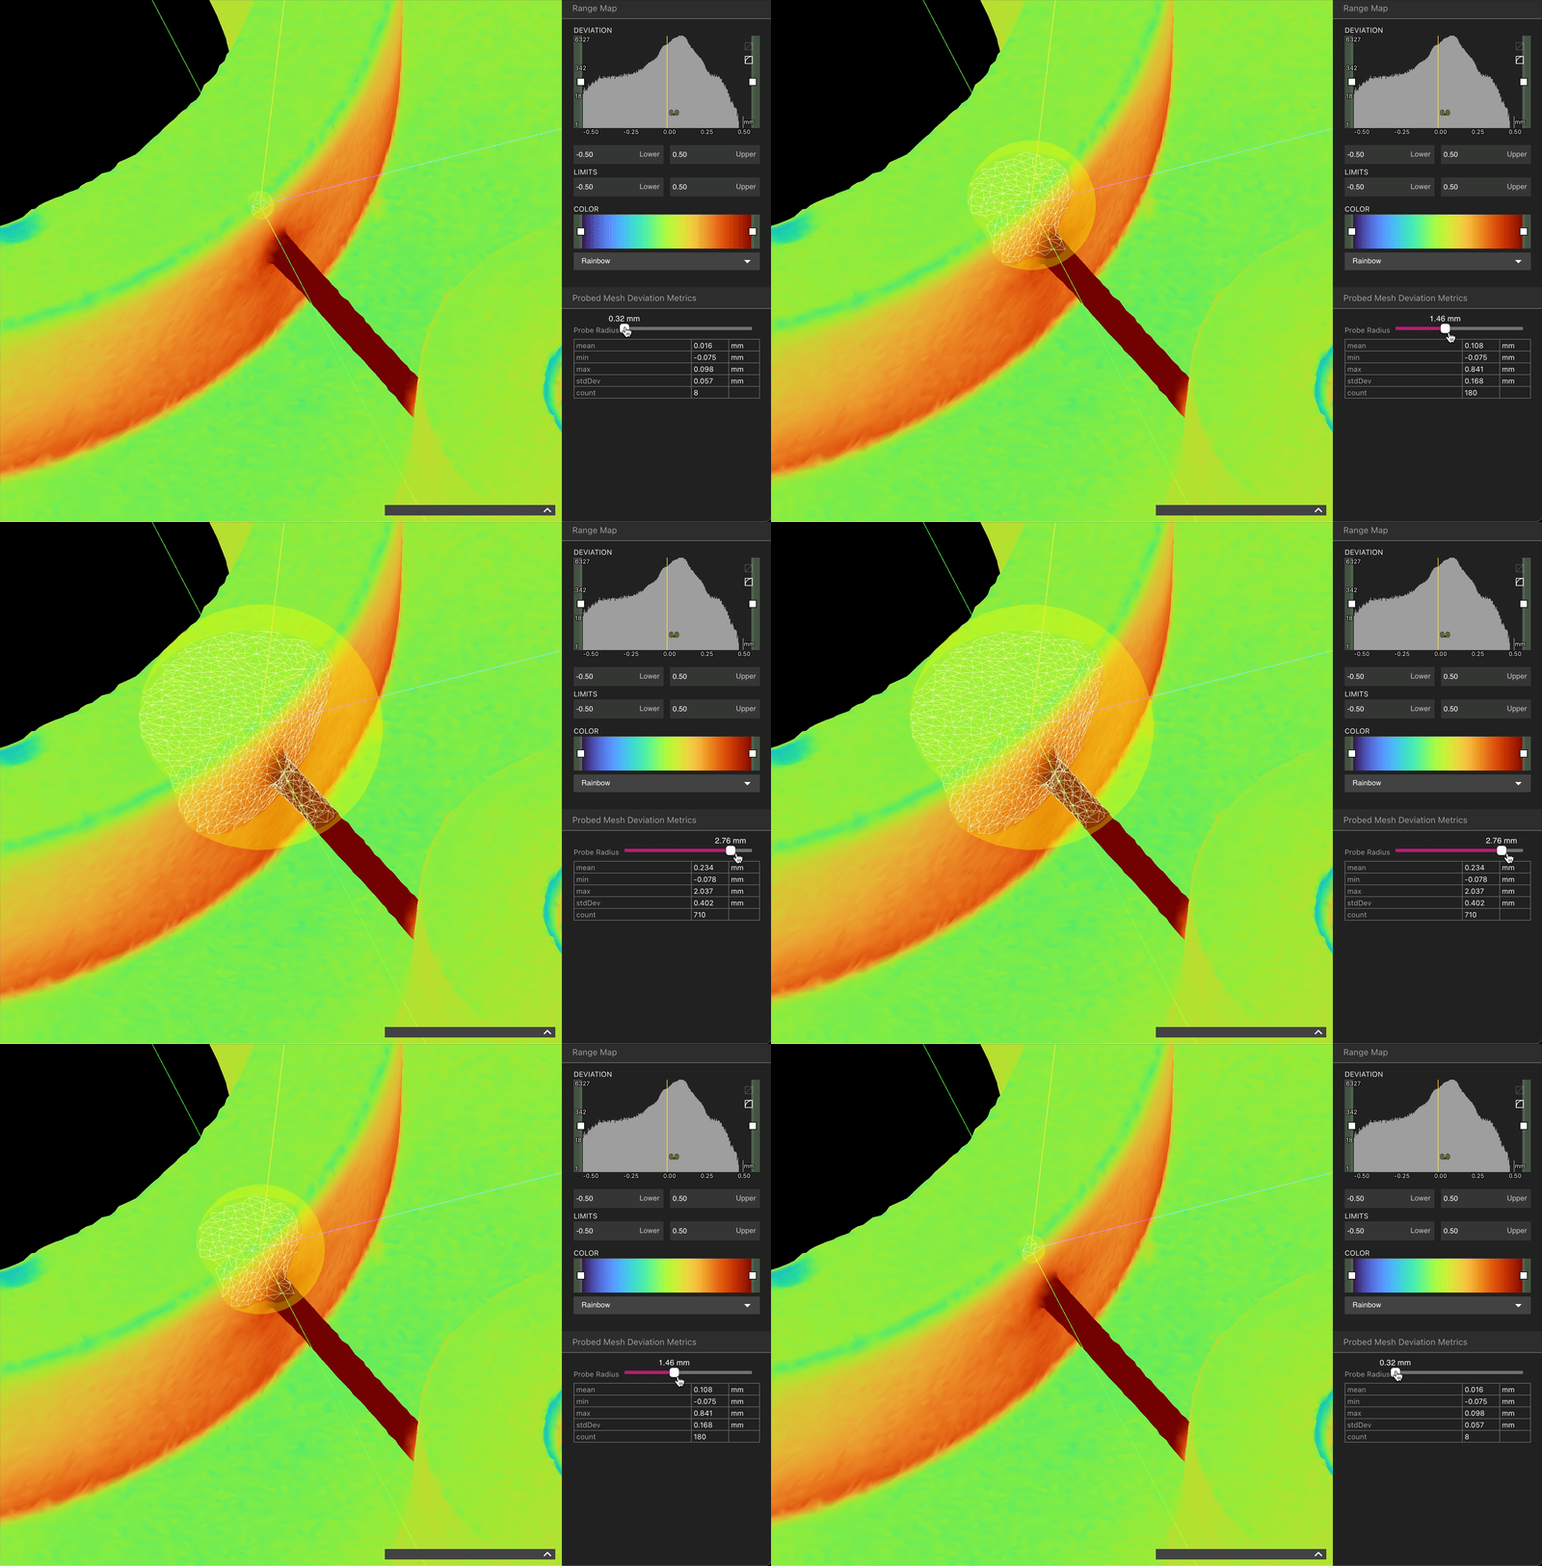
透過調整屬性面板中的滑桿，可以變更探針球體的大小以捕捉更多或更少的多邊形。

<img height="200" src="https://mintcdn.com/lumafield/iD2sgKuz7BoMpq7k/images/comparison-probe-tool-radius.gif?s=cb68d15da470e676761389fd7be6ed70" data-path="images/comparison-probe-tool-radius.gif" />

<Warning>
  請注意，由於探頭是球形的，因此可能包含可能影響平均偏差的特徵。
</Warning>

<img height="200" src="https://mintcdn.com/lumafield/iD2sgKuz7BoMpq7k/images/comparison-probe-tool-radius-caution.gif?s=1c771c7b5b56c9cd067409d71ef3f512" data-path="images/comparison-probe-tool-radius-caution.gif" />

<h3 id="2d">
  QR 圖
</h3>

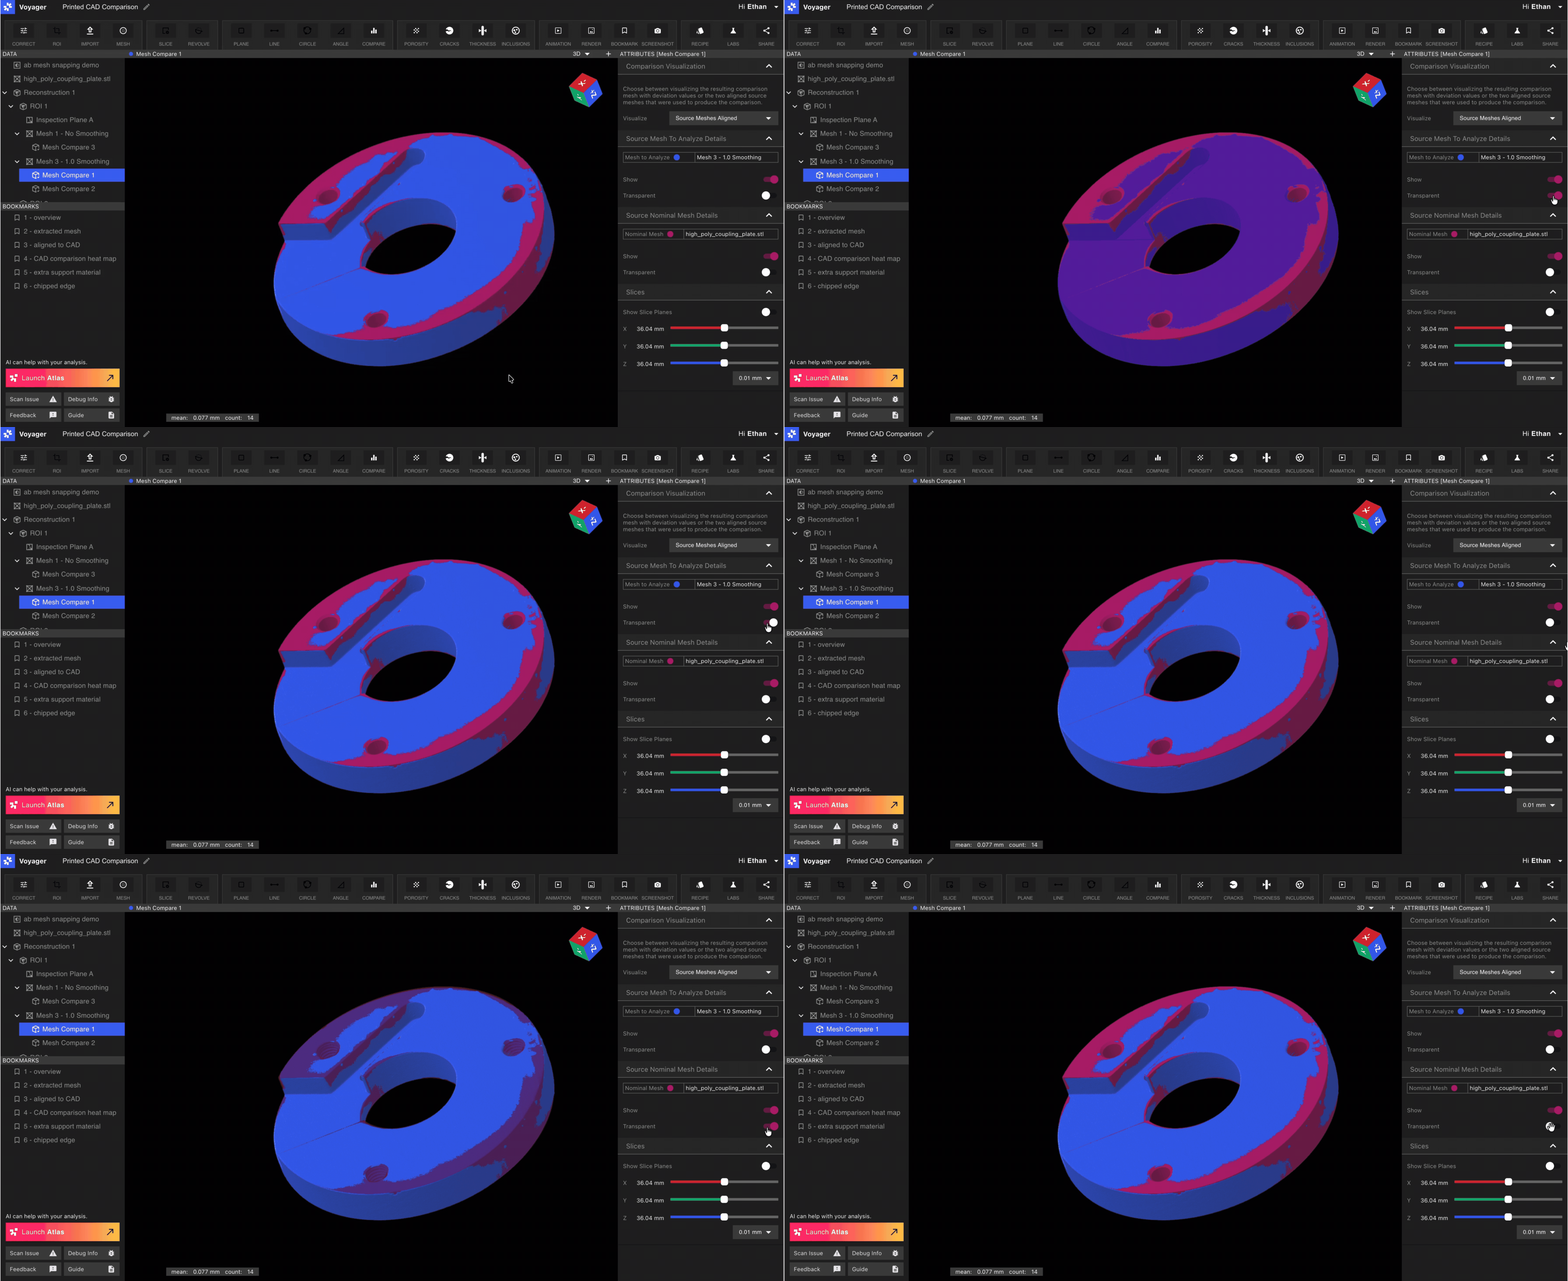
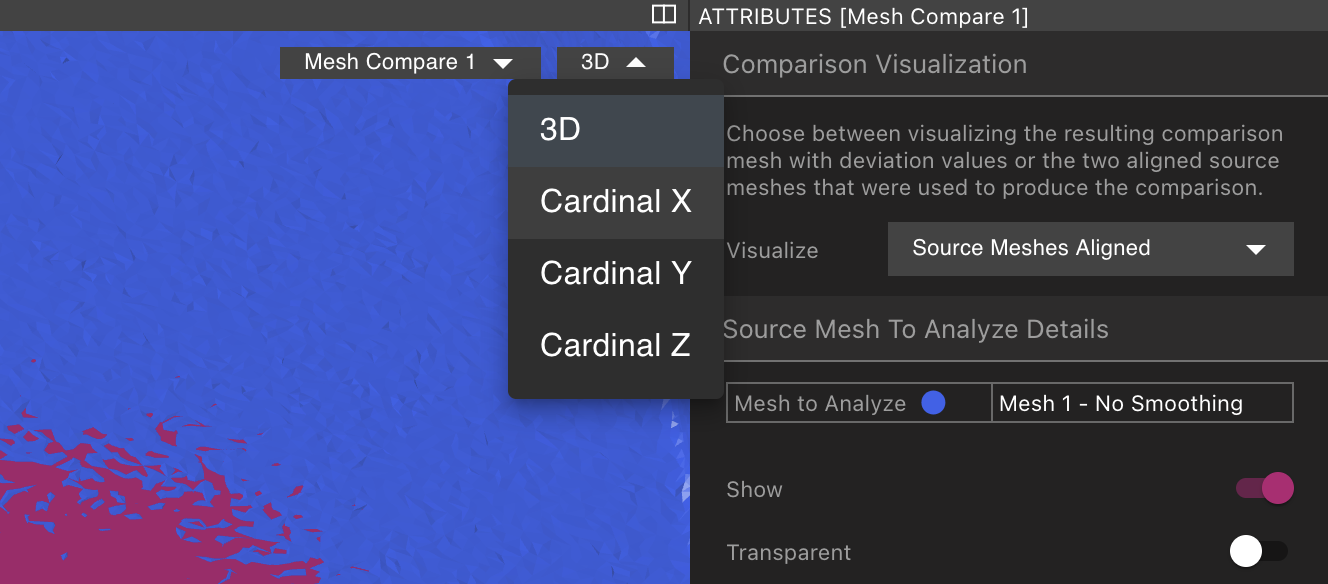
也可以以 2D 方式查看比較分析結果。  若要進入 2D 模式，請從屬性面板的「視覺化」下拉式功能表中選擇「來源網格對齊」。

<Frame>
  <img src="https://mintcdn.com/lumafield/m5QGN5HaY0IKqsU9/images/Compare_Source_Meshes_Aligned.png?fit=max&auto=format&n=m5QGN5HaY0IKqsU9&q=85&s=cb8ac4f2fd9b1ba2b9f5a9675b4b6387" alt="比對：來源網格已對齊" width="2016" height="1580" data-path="images/Compare_Source_Meshes_Aligned.png" />
</Frame>

在 2D 模式下，您可以調整分析和名義網格的 3D 視覺化設定：

<Frame>
  <img src="https://mintcdn.com/lumafield/m5QGN5HaY0IKqsU9/images/Compare_Transparent.gif?s=ef21b828a36623579183c7da280921d6" alt="比對：透明顯示" width="3024" height="1650" data-path="images/Compare_Transparent.gif" />
</Frame>

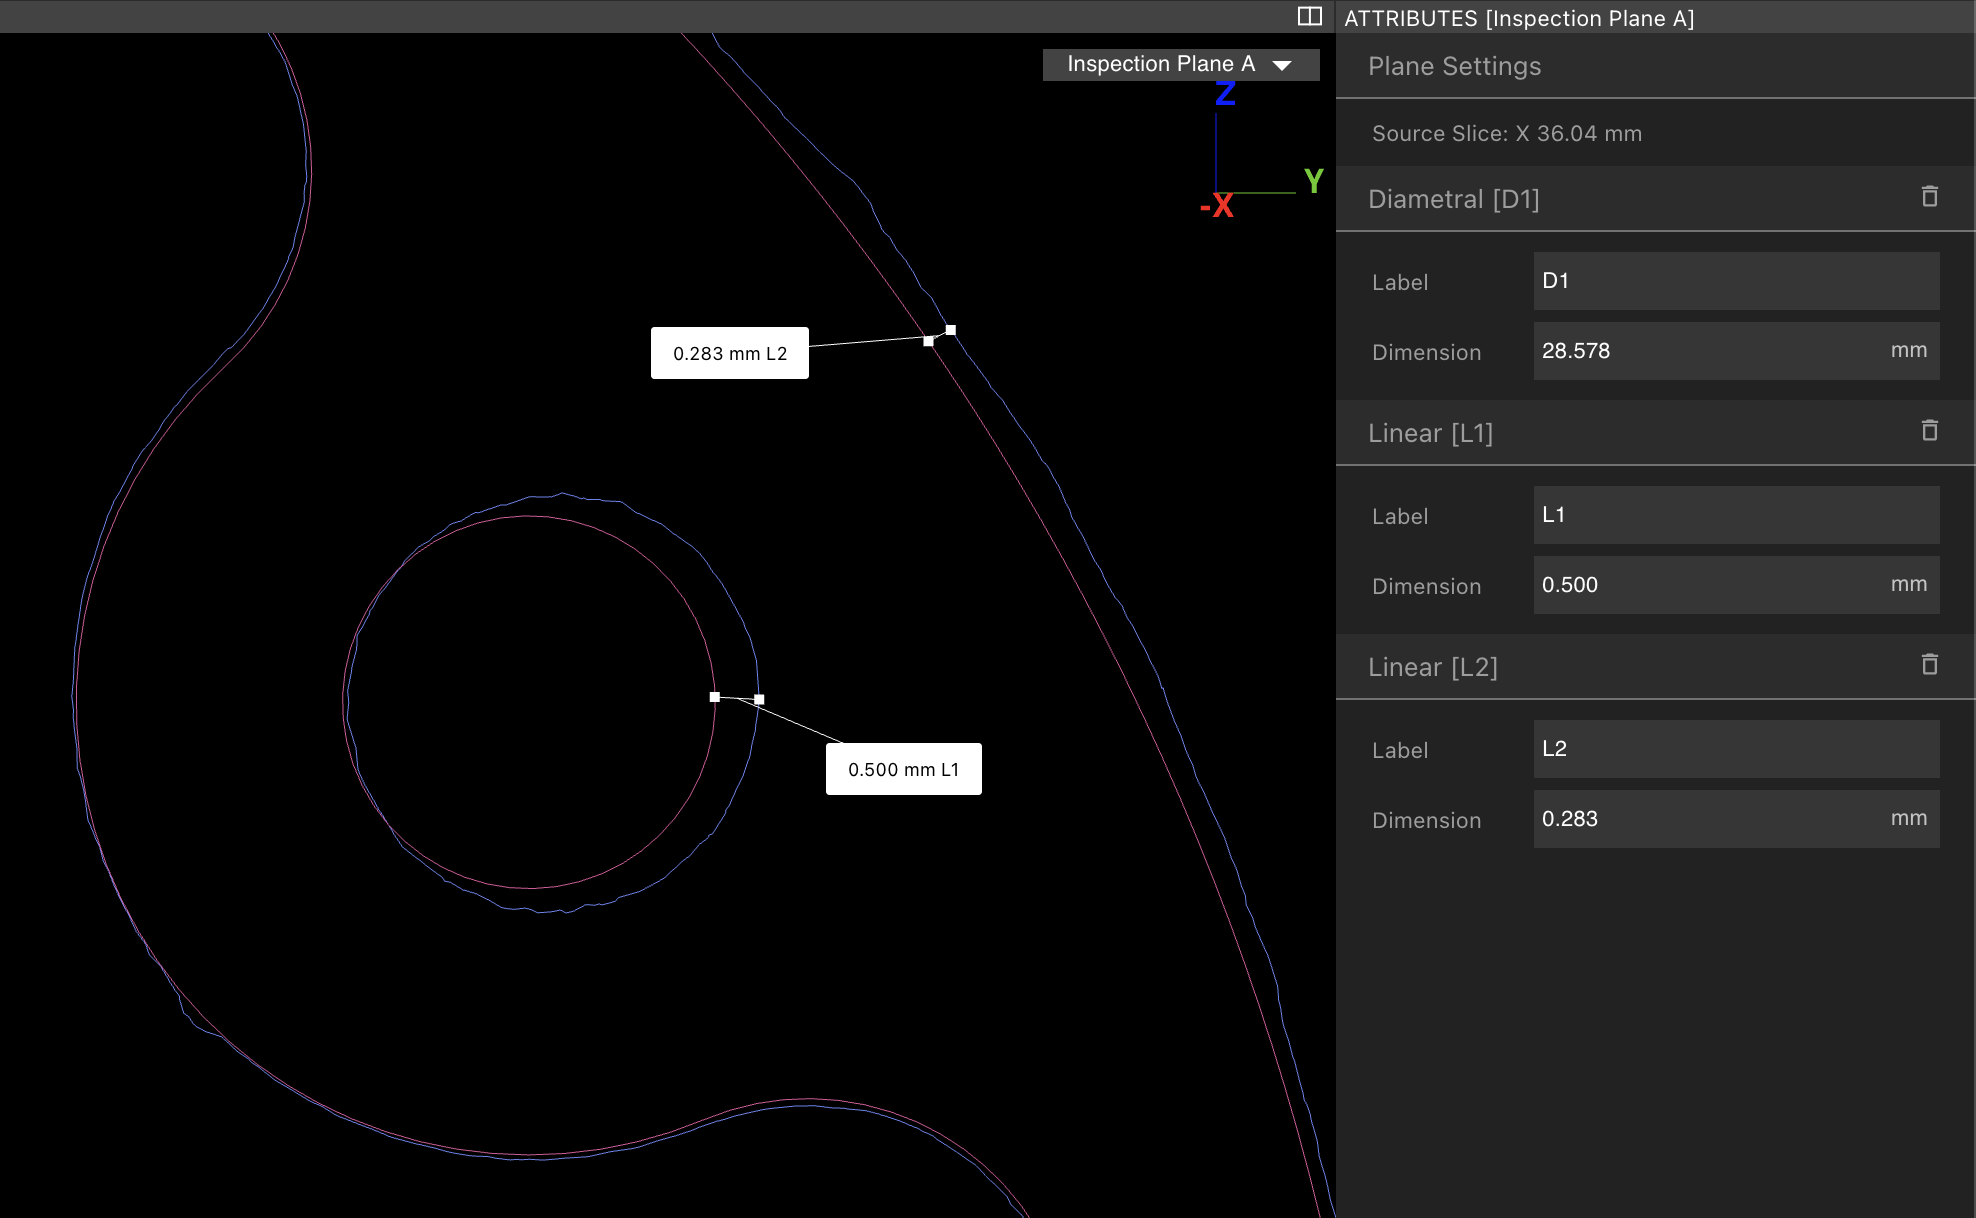
透過從下拉式選單中選擇切片，您可以檢查 2D 中的比較並使用[檢查平面](/zh-Hant/voyager/voyager-inspection-planes) 應用測量
<img height="200" src="https://mintcdn.com/lumafield/iD2sgKuz7BoMpq7k/images/comparison-2d-select-slice.png?fit=max&auto=format&n=iD2sgKuz7BoMpq7k&q=85&s=91cfb6c6e83f8d560fe4d4dc23a54c8c" data-path="images/comparison-2d-select-slice.png" />

<img height="200" src="https://mintcdn.com/lumafield/iD2sgKuz7BoMpq7k/images/comparison-2d-inspection-plane.png?fit=max&auto=format&n=iD2sgKuz7BoMpq7k&q=85&s=7be8427be4a89ffd206168fb547ea5c8" data-path="images/comparison-2d-inspection-plane.png" />

<h2 id="troubleshooting-and-common-problems">
  故障排除和常見問題
</h2>

<h3 id="histogram-just-has-one-skinny-spike">
  直方圖只有一個細尖峰
</h3>

網格中的每個頂點都包含在比較分析中，因此如果您的分析網格具有無關的網格片段或具有空隙（例如在鑄造或註塑組件的情況下）或雜散的網格片段，則還將計算標稱表面和這些表面之間的距離。

可以透過兩種方法減少這種影響的影響：

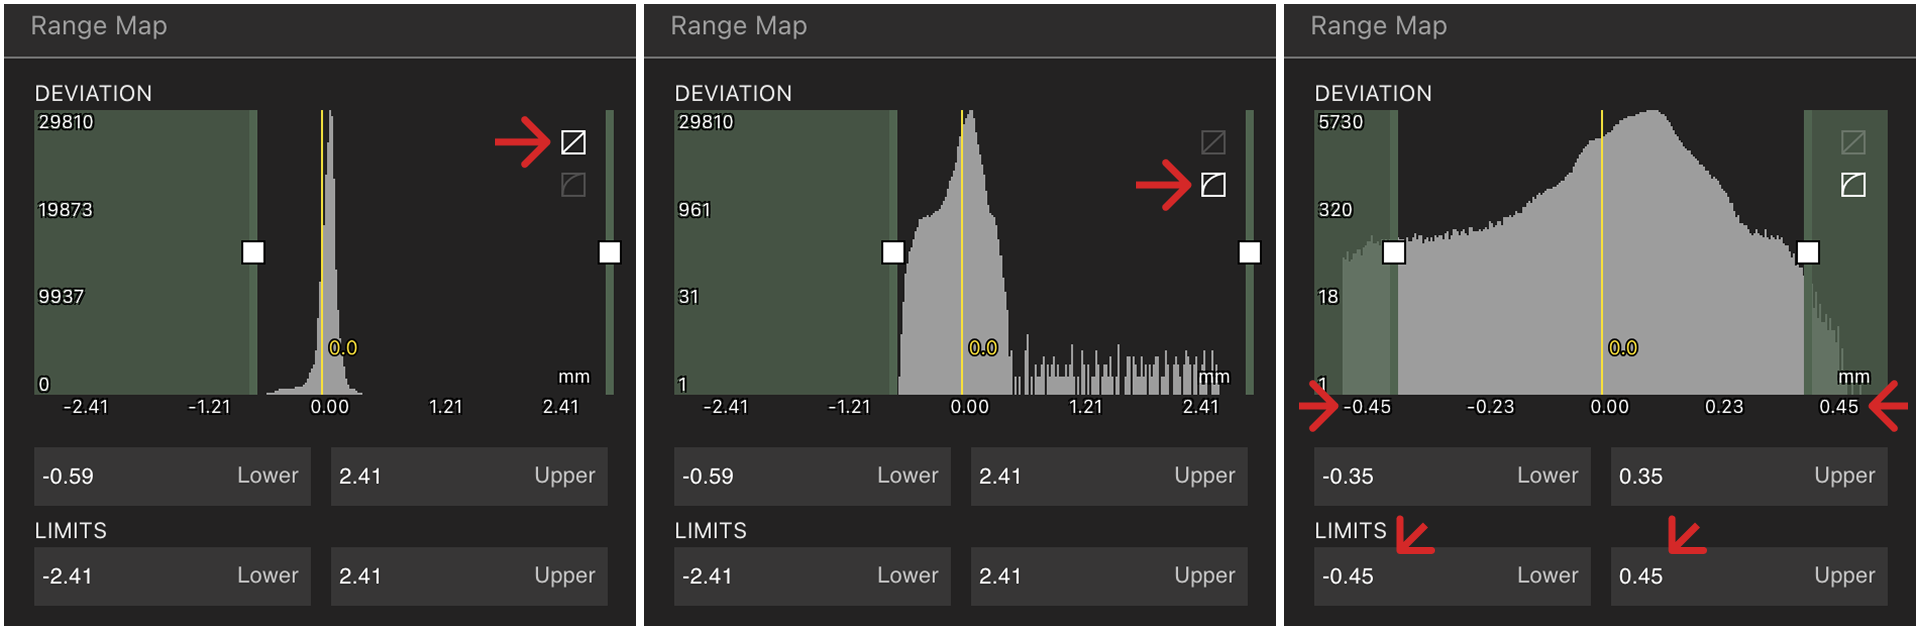
1. 使用範圍映射器排除異常值。  這可以透過將範圍映射器切換到日誌模式（右上角按鈕）然後指定更適合偏差分佈的新限制來完成。

<img height="200" src="https://mintcdn.com/lumafield/iD2sgKuz7BoMpq7k/images/comparison-rangemapper-range.png?fit=max&auto=format&n=iD2sgKuz7BoMpq7k&q=85&s=58ff3e38b932550c296febf9b49c9a0b" data-path="images/comparison-rangemapper-range.png" />

2. 匯出分析網格並在 Meshlab 等第三方工具中清理，以刪除斷開連接的實體或修剪無關的表面。  重新上傳並重新計算您的分析。

<h3 id="stripes-in-the-comparison-results">
  比較結果中的“條紋”
</h3>

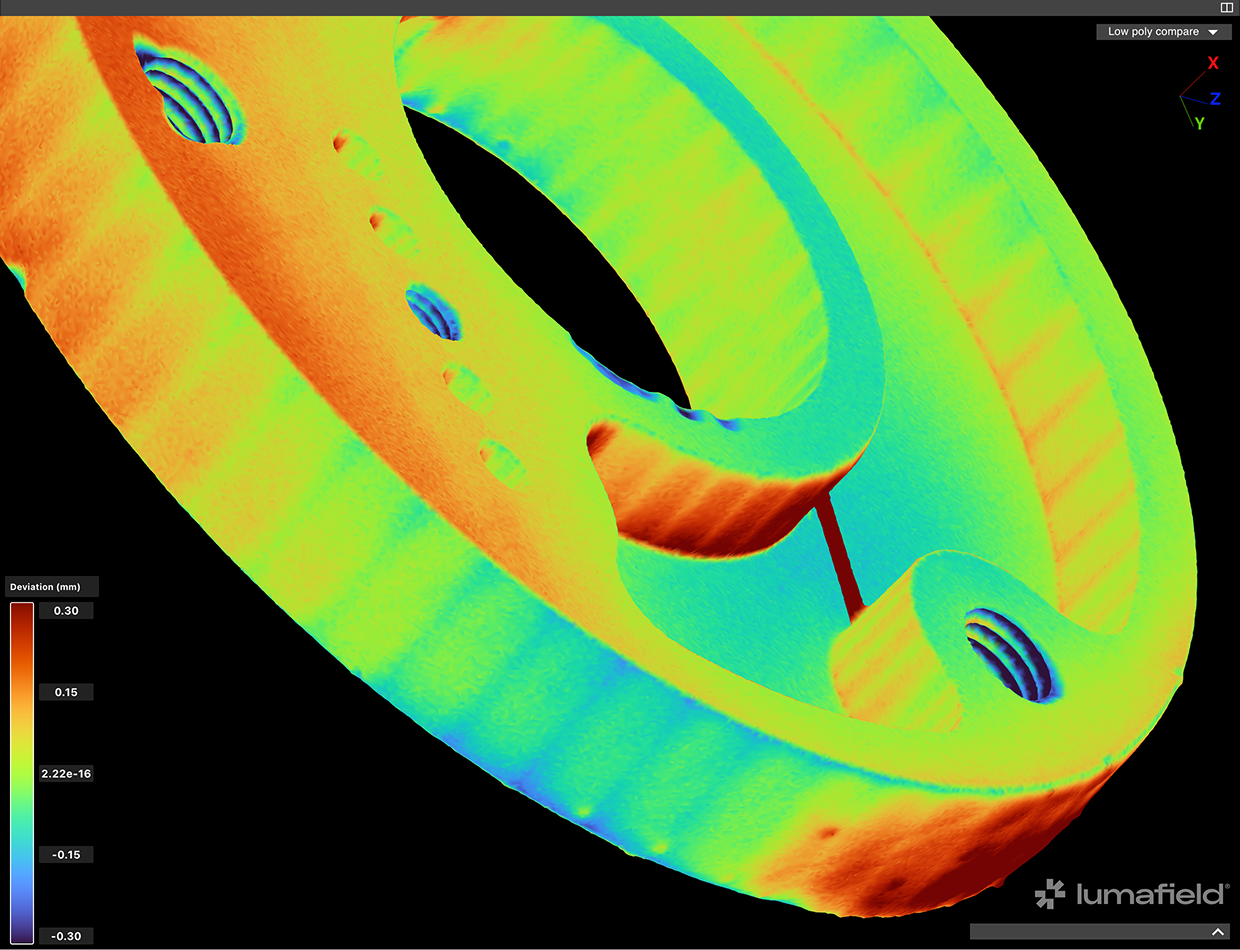
如下例所示的比較分析結果中的「條紋」是由於標稱網格上的多邊形計數太少所造成的。  如果使用 CAD 工具匯出標稱零件的 STL，請增加多邊形的數量。  如果使用掃描網格，請使用更高的多邊形數重新匯出。

<img height="200" src="https://mintcdn.com/lumafield/iD2sgKuz7BoMpq7k/images/comparison-with-low-poly-mesh.png?fit=max&auto=format&n=iD2sgKuz7BoMpq7k&q=85&s=81eab26d00a51b5bc14fd2ed5974a10d" data-path="images/comparison-with-low-poly-mesh.png" />