> ## Documentation Index
> Fetch the complete documentation index at: https://support.lumafield.com/llms.txt
> Use this file to discover all available pages before exploring further.
# 壁厚分析
> 使用壁厚分析來測量和評估零件的壁組件和結構完整性。識別缺陷區域、量化厚度均勻性並優化材料使用。
概述與設置
若要使用壁厚分析,請確保您的組織中啟動了 [Integrity Analysis](https://support.lumafield.com/zh-Hant/platform/analysis-modules#integrity-analysis-2) 模組。
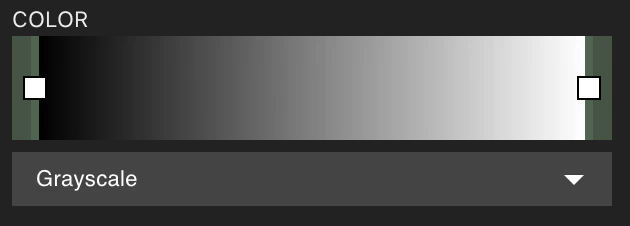
 在開始壁厚分析工作流程之前,我們建議將您要分析的 Reconstruction 或 ROI 切換為灰階視覺化。這有助於區分您設定的牆閾值和掃描中的實際牆邊界。
 1. **點擊工具列中的「壁厚分析」按鈕**開始工作流程。
2. **選擇您要分析的體積**。請注意,您可以並行執行多個壁厚分析。給定分析的處理時間取決於完整解析體積中的體素數量。我們建議縮小您的 ROI 以減少所需的體素數量。在整個體積上執行可能需要一個多小時,類似於 FEA 或 CFD 等模擬。
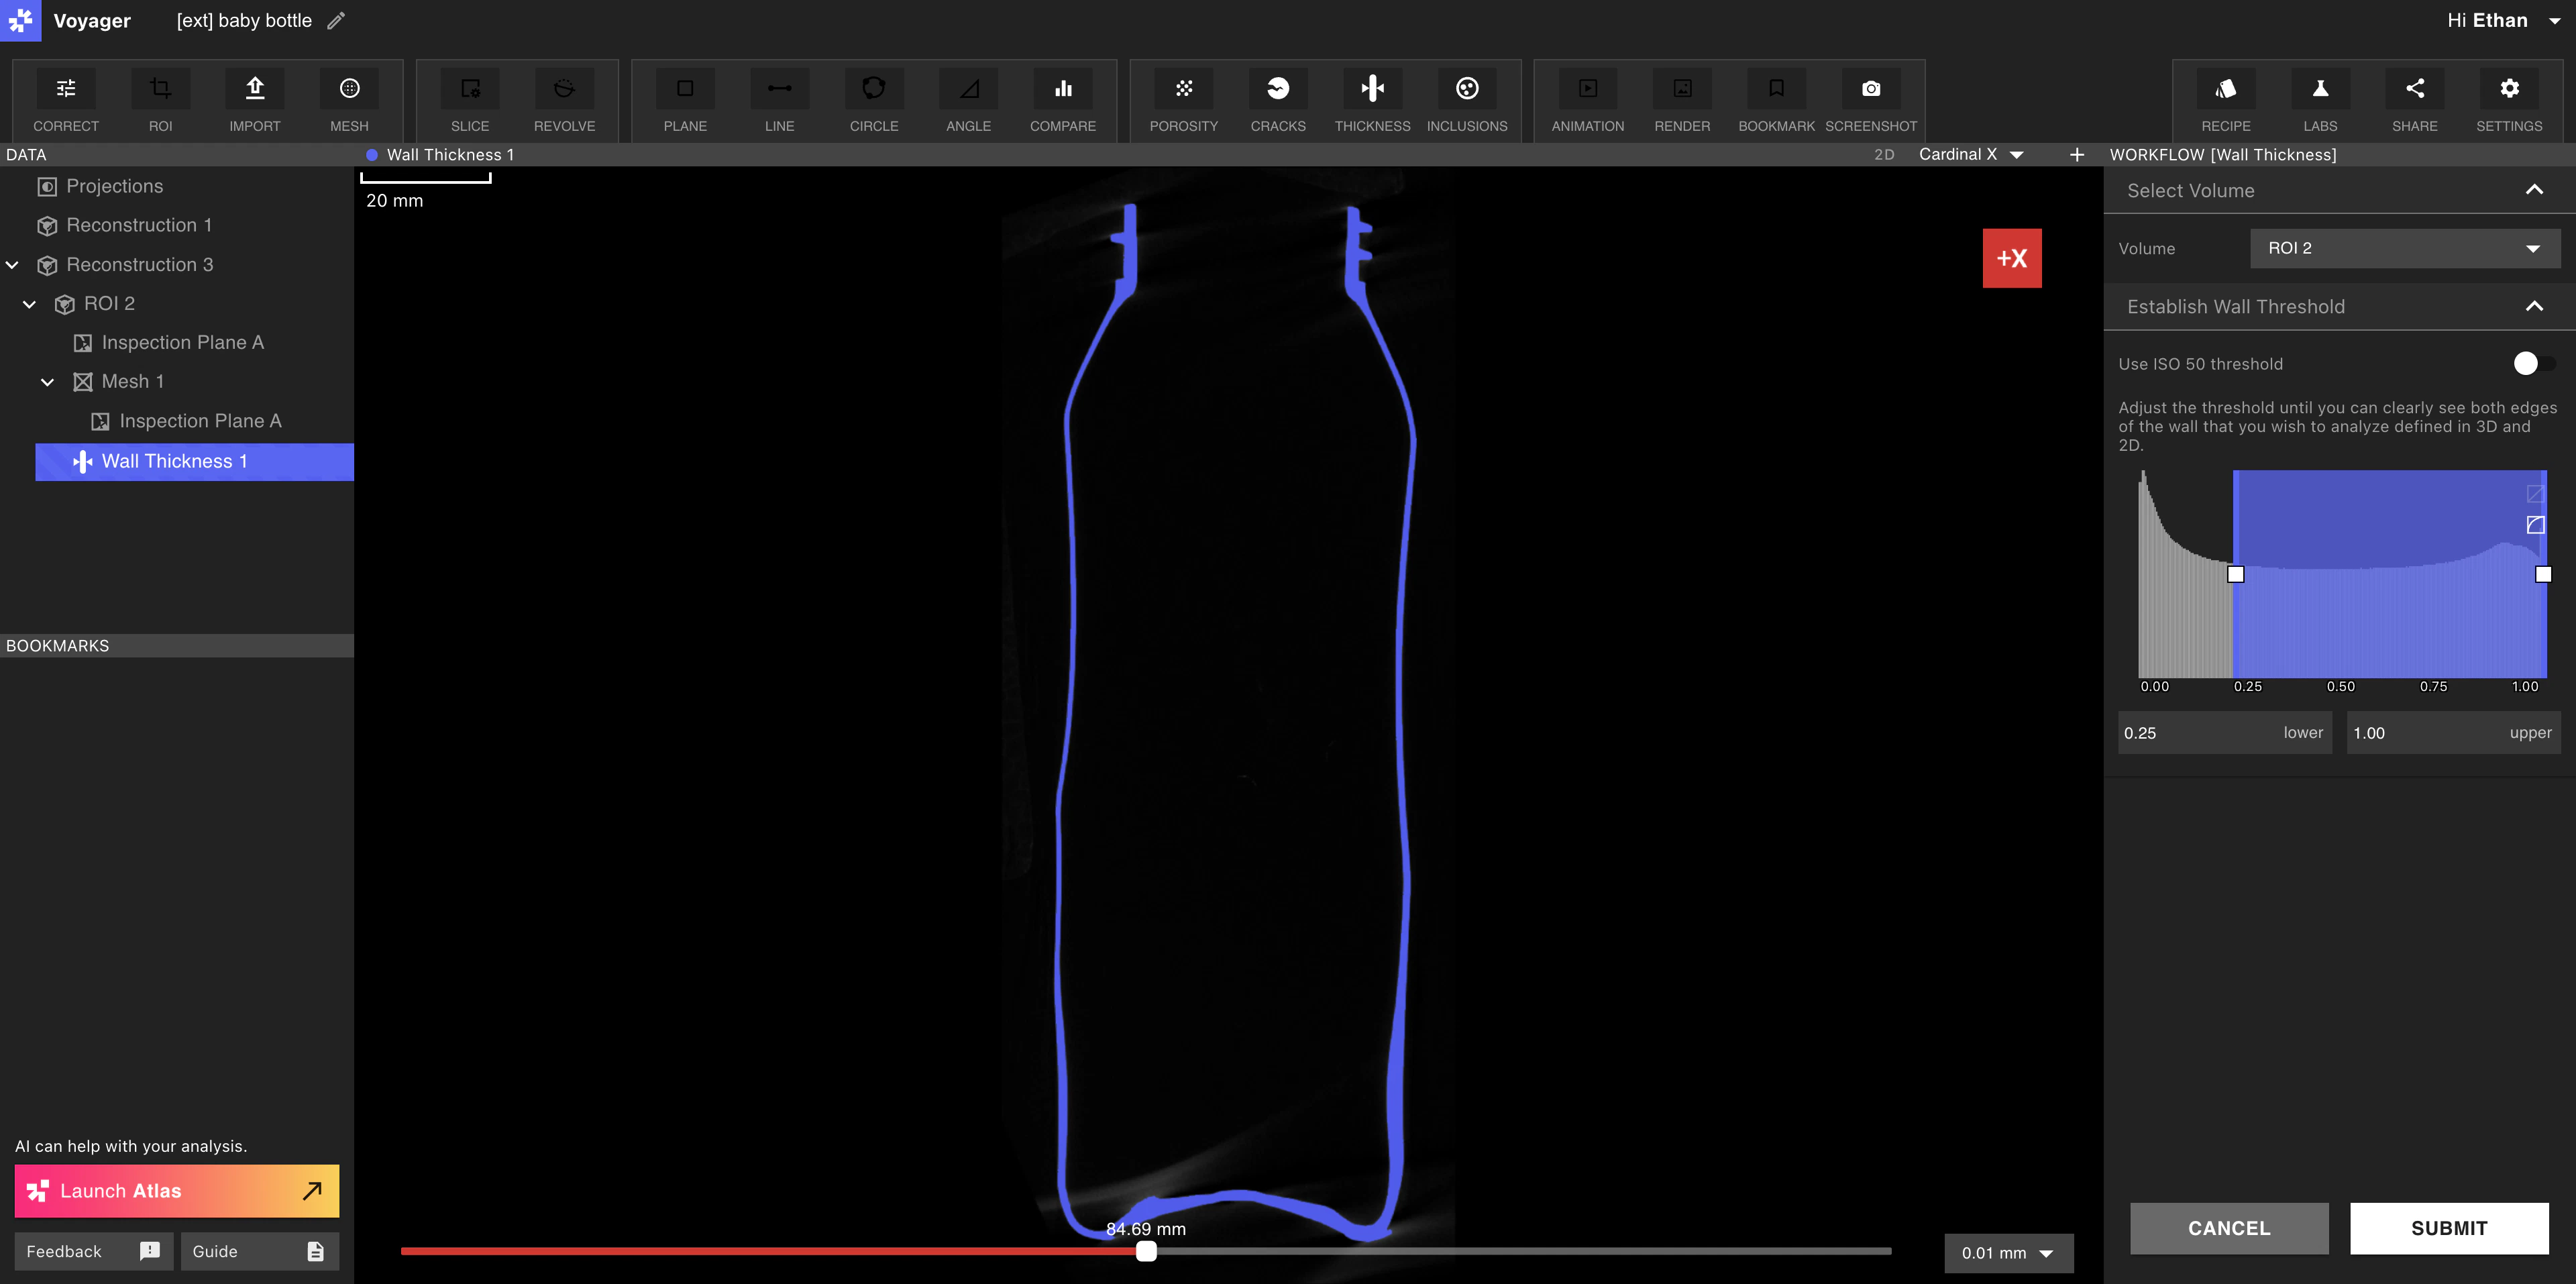
3. **調整閾值,直到您可以清楚地看到要分析的藍色牆壁的兩個邊緣**。在[2D 視圖](https://support.lumafield.com/zh-Hant/voyager/voyager-getting-around#2d-and-3d-views)中查看閾值通常最有幫助。在單一材料零件中,我們通常建議只調整下限閾值。對於多材料零件,調整上限閾值有助於在分析中隔離密度更高的材料。
4. 設定閾值後,**點擊「提交」即可在雲端處理分析**。
*在上面的範例中,閾值被設置為剛好覆蓋掃描的灰色牆邊界。*
1. **點擊工具列中的「壁厚分析」按鈕**開始工作流程。
2. **選擇您要分析的體積**。請注意,您可以並行執行多個壁厚分析。給定分析的處理時間取決於完整解析體積中的體素數量。我們建議縮小您的 ROI 以減少所需的體素數量。在整個體積上執行可能需要一個多小時,類似於 FEA 或 CFD 等模擬。
3. **調整閾值,直到您可以清楚地看到要分析的藍色牆壁的兩個邊緣**。在[2D 視圖](https://support.lumafield.com/zh-Hant/voyager/voyager-getting-around#2d-and-3d-views)中查看閾值通常最有幫助。在單一材料零件中,我們通常建議只調整下限閾值。對於多材料零件,調整上限閾值有助於在分析中隔離密度更高的材料。
4. 設定閾值後,**點擊「提交」即可在雲端處理分析**。
*在上面的範例中,閾值被設置為剛好覆蓋掃描的灰色牆邊界。*
查看和分析結果
分析執行後,若要查看結果,請按一下左側「資料面板」中的壁厚分析物件。它嵌套在其父卷下。
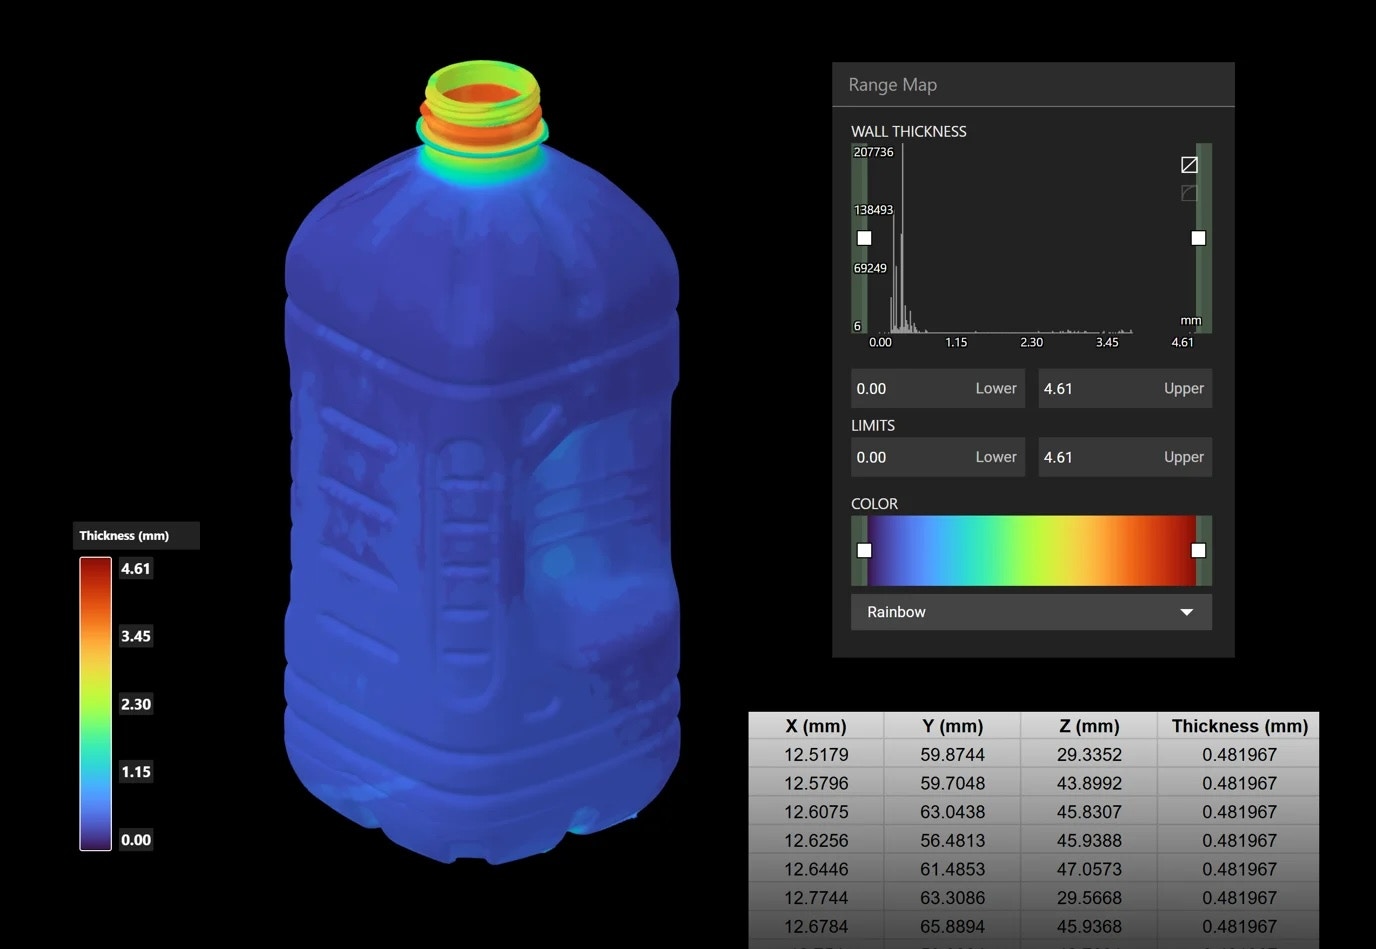
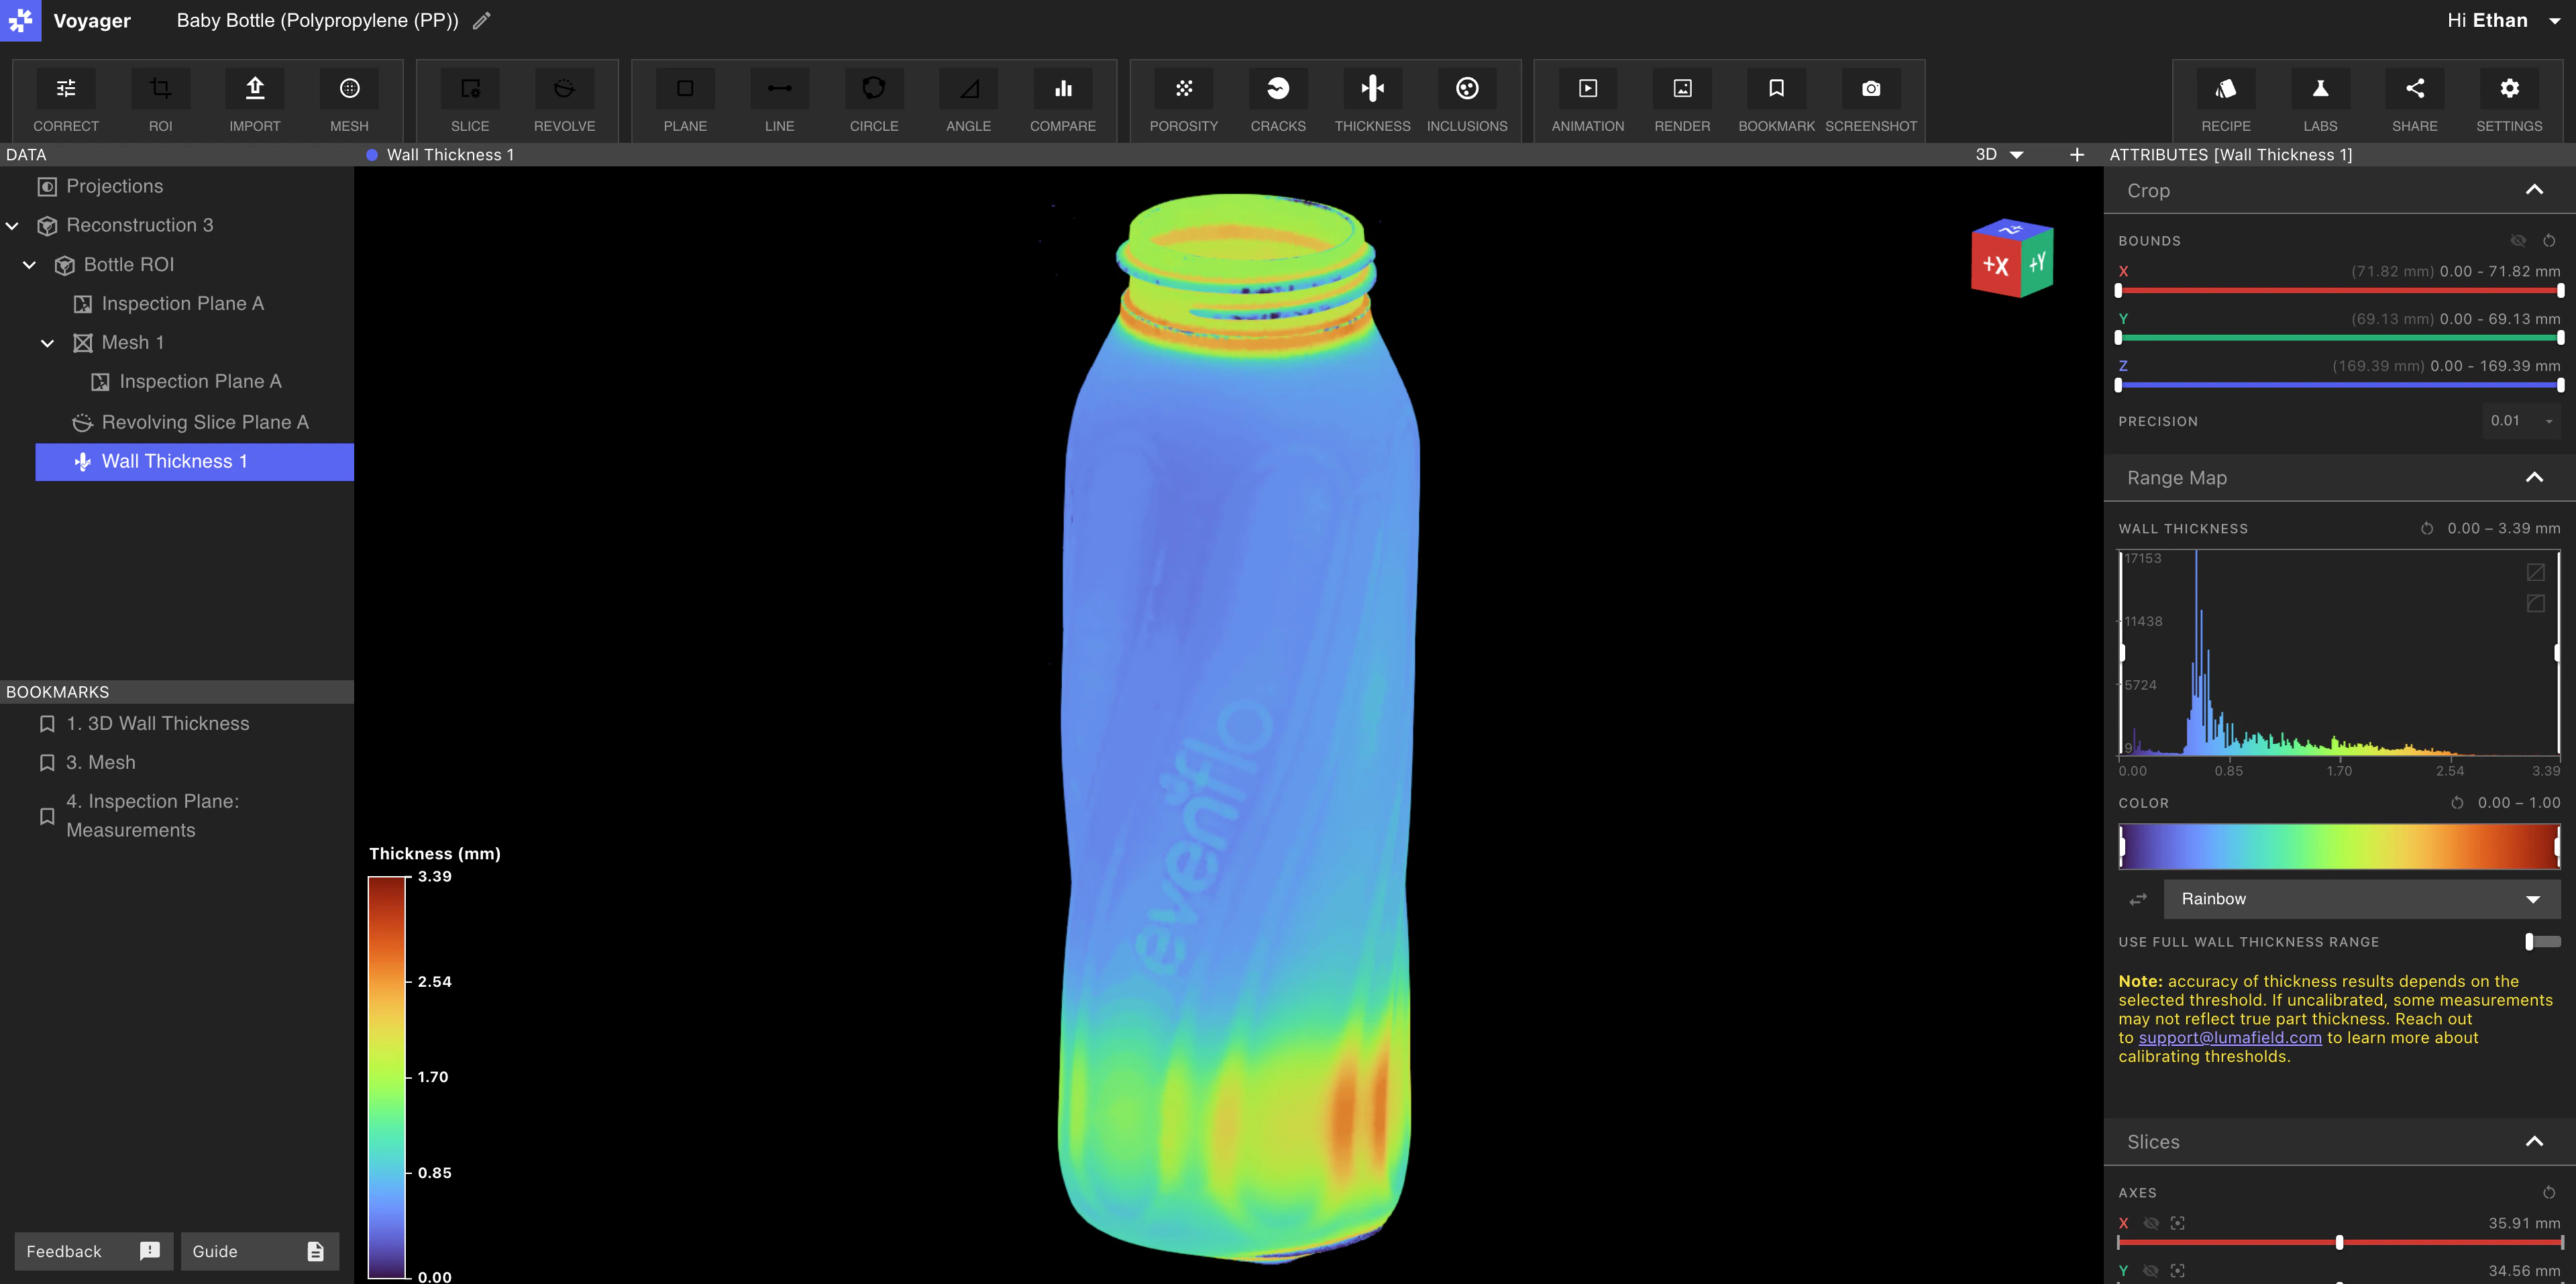 掃描件上顯示的顏色代表壁厚測量的範圍。您可以透過右側「屬性面板」中的範圍圖來調整視覺化效果。使用穀倉門強制執行公差範圍或調整地圖下方的範圍限制。
在比較、校準和分享分析結果時,用探測點測量補充視覺壁厚圖會很有幫助。
掃描件上顯示的顏色代表壁厚測量的範圍。您可以透過右側「屬性面板」中的範圍圖來調整視覺化效果。使用穀倉門強制執行公差範圍或調整地圖下方的範圍限制。
在比較、校準和分享分析結果時,用探測點測量補充視覺壁厚圖會很有幫助。
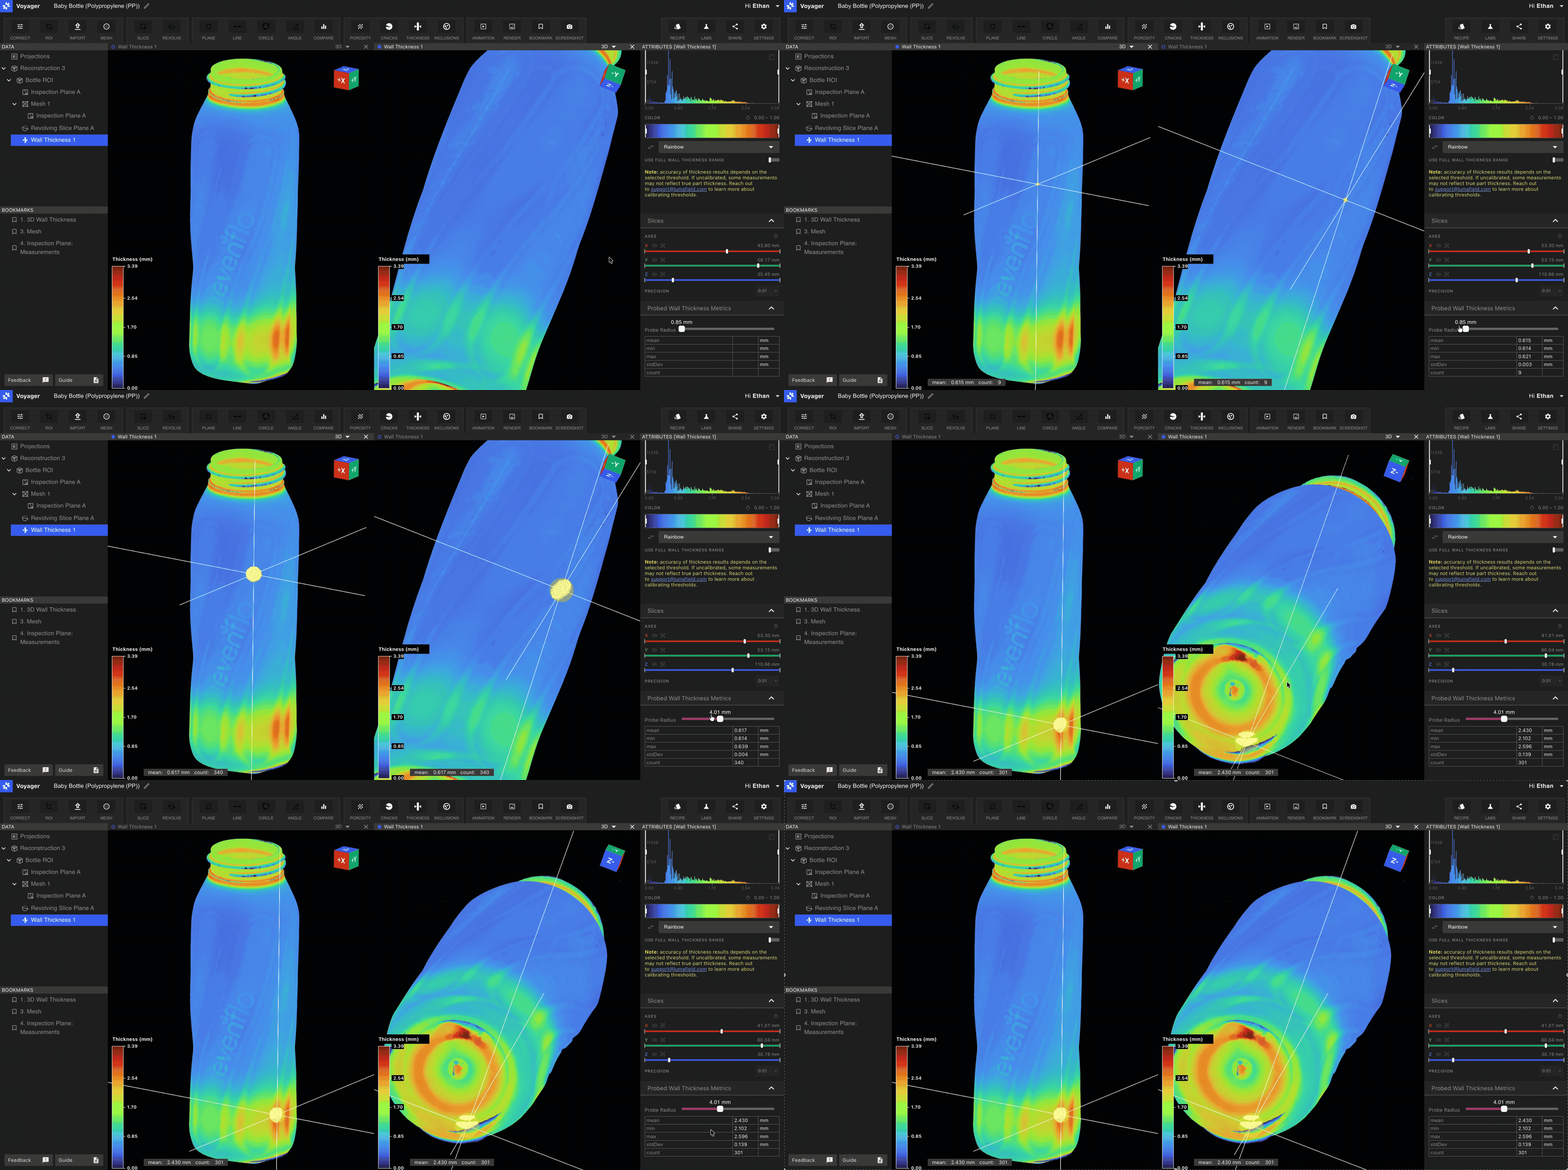 要使用 Voyager 內建的探測工具:
1. **點擊您想要探測的壁厚分析的 3D 視圖**。
2. **左鍵點擊感興趣的點**以探測該區域。探測工具捕捉球體中的點。您可以向下捲動到右側屬性面板中的「Probe Radius」滑桿來調整探針半徑。它將在Viewport中即時調整。注意:3D 探測區域與分割畫面視圖中對應的 2D 切片同步。
3. **在屬性面板中查看測量結果**。該工具提供:
* 探測表面數量
* 壁厚的最小、最大、平均和標準差值
* 視窗顯示平均值和表面數量
要使用 Voyager 內建的探測工具:
1. **點擊您想要探測的壁厚分析的 3D 視圖**。
2. **左鍵點擊感興趣的點**以探測該區域。探測工具捕捉球體中的點。您可以向下捲動到右側屬性面板中的「Probe Radius」滑桿來調整探針半徑。它將在Viewport中即時調整。注意:3D 探測區域與分割畫面視圖中對應的 2D 切片同步。
3. **在屬性面板中查看測量結果**。該工具提供:
* 探測表面數量
* 壁厚的最小、最大、平均和標準差值
* 視窗顯示平均值和表面數量
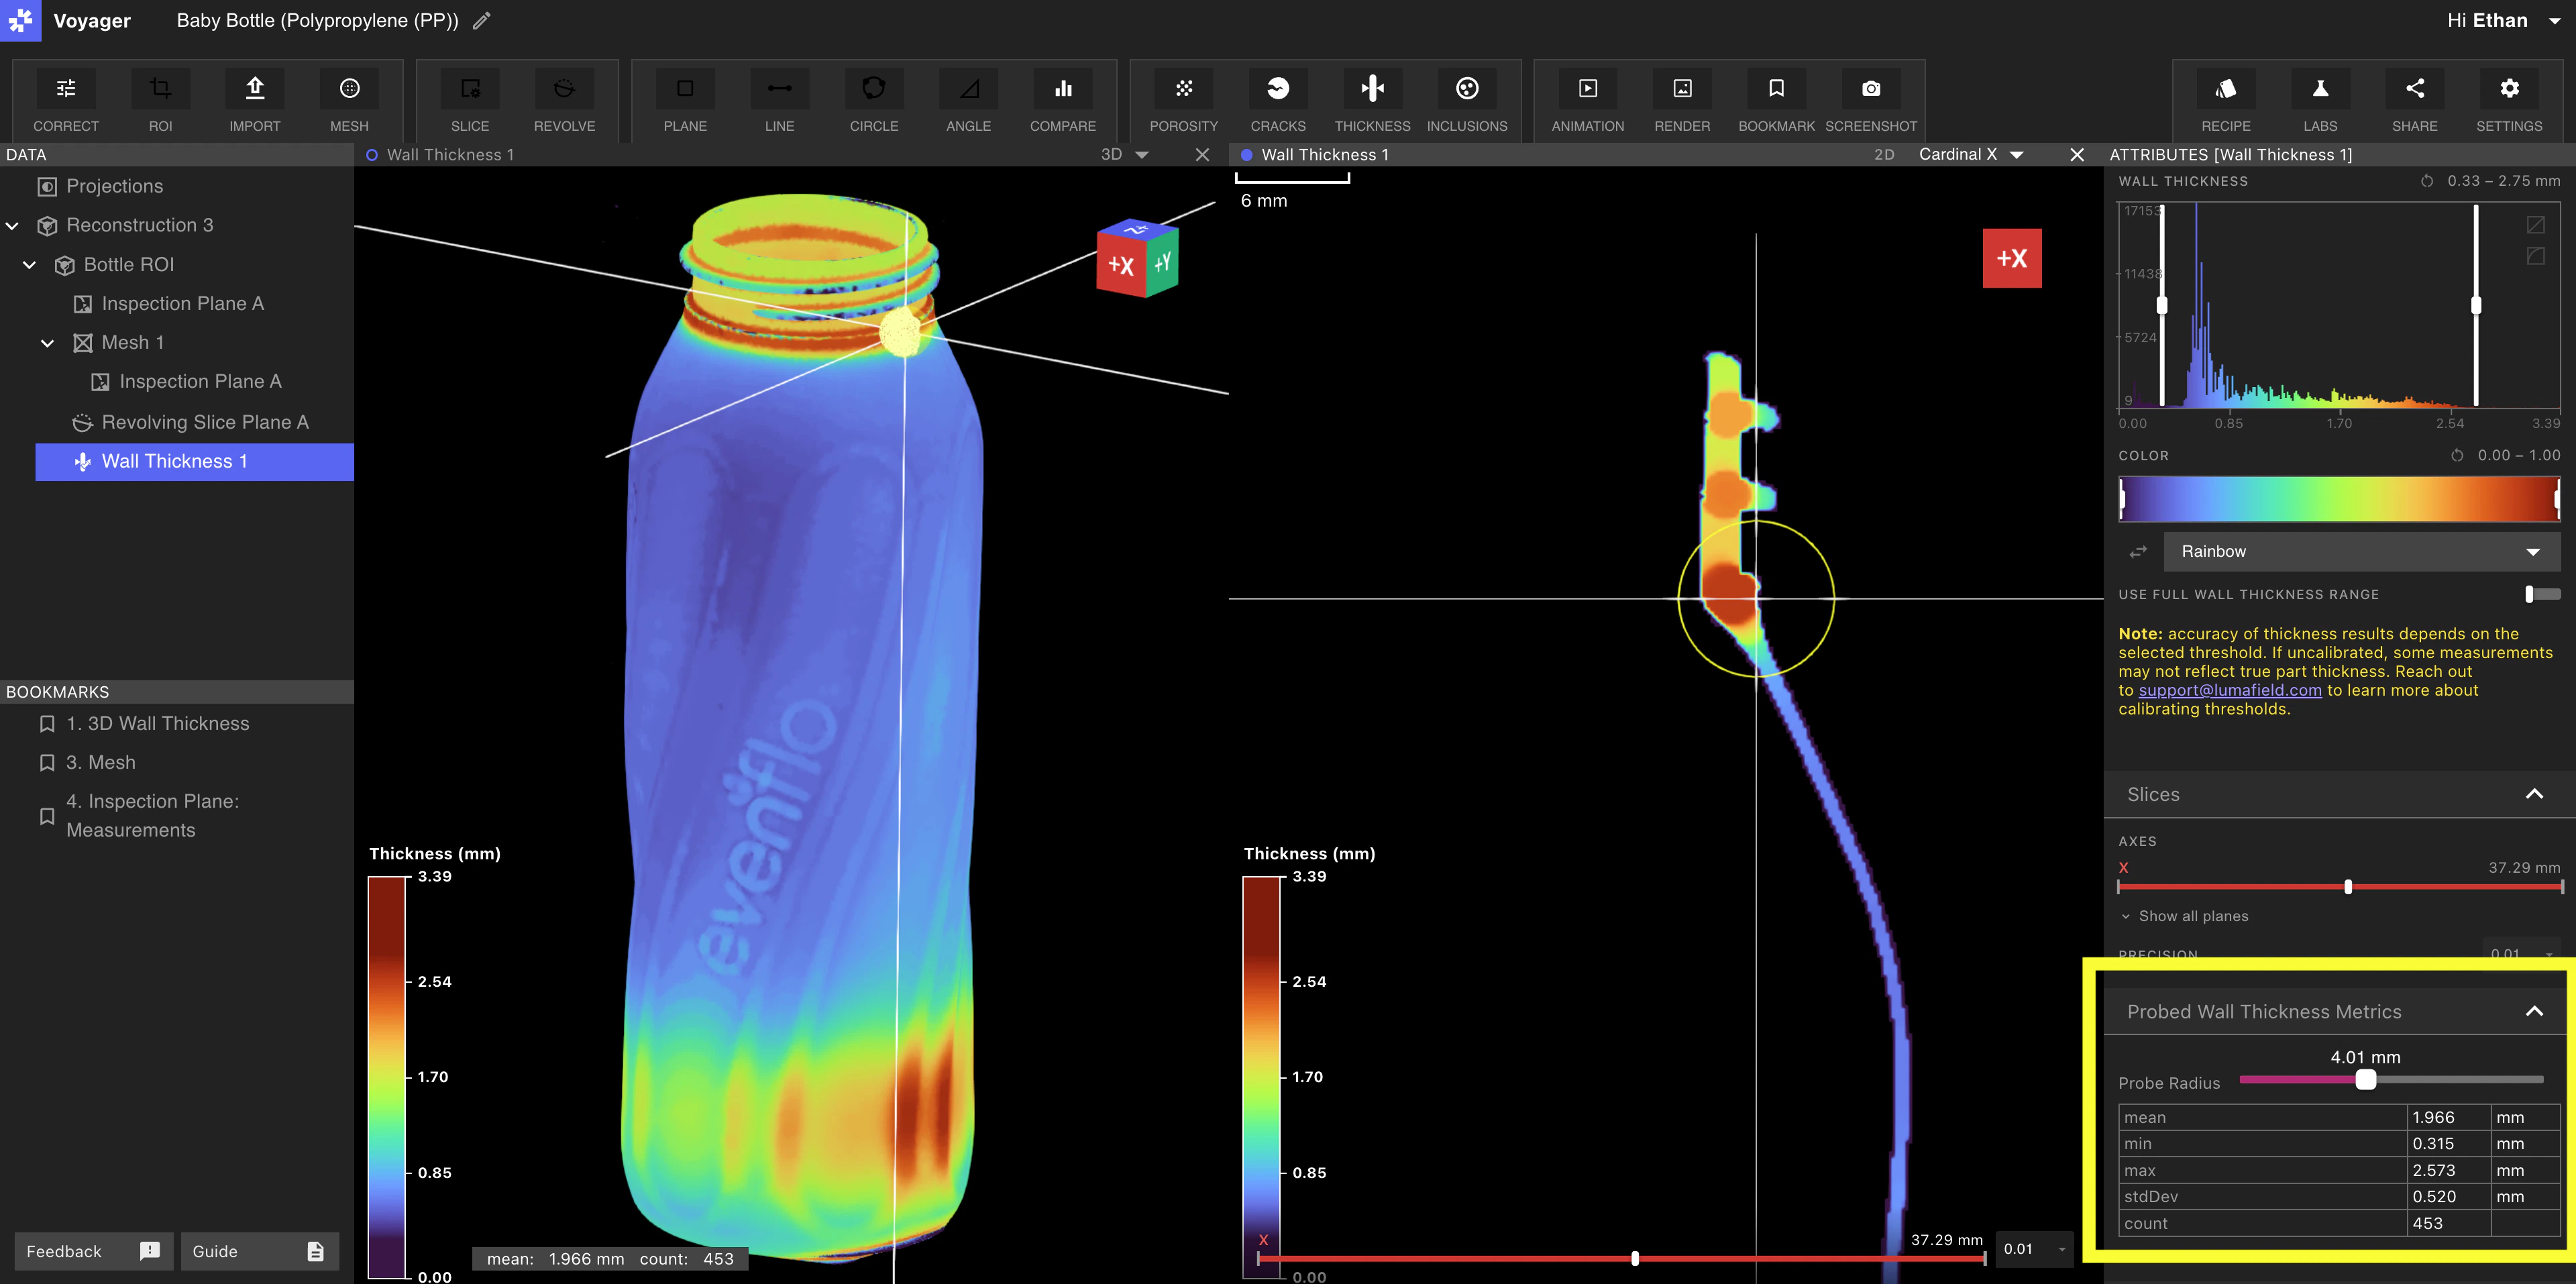 4. **要停用探測工具**,請點擊掃描外部的空間。只需重新點擊表面即可重新激活它。
下載結果
若要下載產生的網格和壁厚結果,請在「屬性面板」中向下捲動並按一下「download」。將下載網格檔案 (.PLY) 和網格頂點(x、y、z 座標)的下採樣 CSV 以及相應的厚度結果。