Reveal the presence of pores within a part using the Porosity Tool. The Porosity Tool runs a Porosity Analysis Workflow on a Reconstruction or ROI, and produces a Porosity Analysis Data Object. Dynamically view all pores detected through the Porosity Analysis Workflow, and gain insights with individual and bulk pore metrics.
 The Porosity Tool detects and displays pores, regions with lower attenuation relative to surrounding material. Pores are detected when fully enclosed by higher-attenuation material. For surface-connected voids that are not fully enclosed, an optional crack-detection setting can include these features in the analysis results.
The Porosity Analysis Workflow features an attenuation difference control in the form of a lower bound; ie. an attenuation value below which all data (if enclosed) is considered to be a pore. To generate a Data Object displaying all enclosed regions that fall between a specified band of attenuation, see the Inclusion Tool article.
The Porosity Tool detects and displays pores, regions with lower attenuation relative to surrounding material. Pores are detected when fully enclosed by higher-attenuation material. For surface-connected voids that are not fully enclosed, an optional crack-detection setting can include these features in the analysis results.
The Porosity Analysis Workflow features an attenuation difference control in the form of a lower bound; ie. an attenuation value below which all data (if enclosed) is considered to be a pore. To generate a Data Object displaying all enclosed regions that fall between a specified band of attenuation, see the Inclusion Tool article.
Authoring Porosity
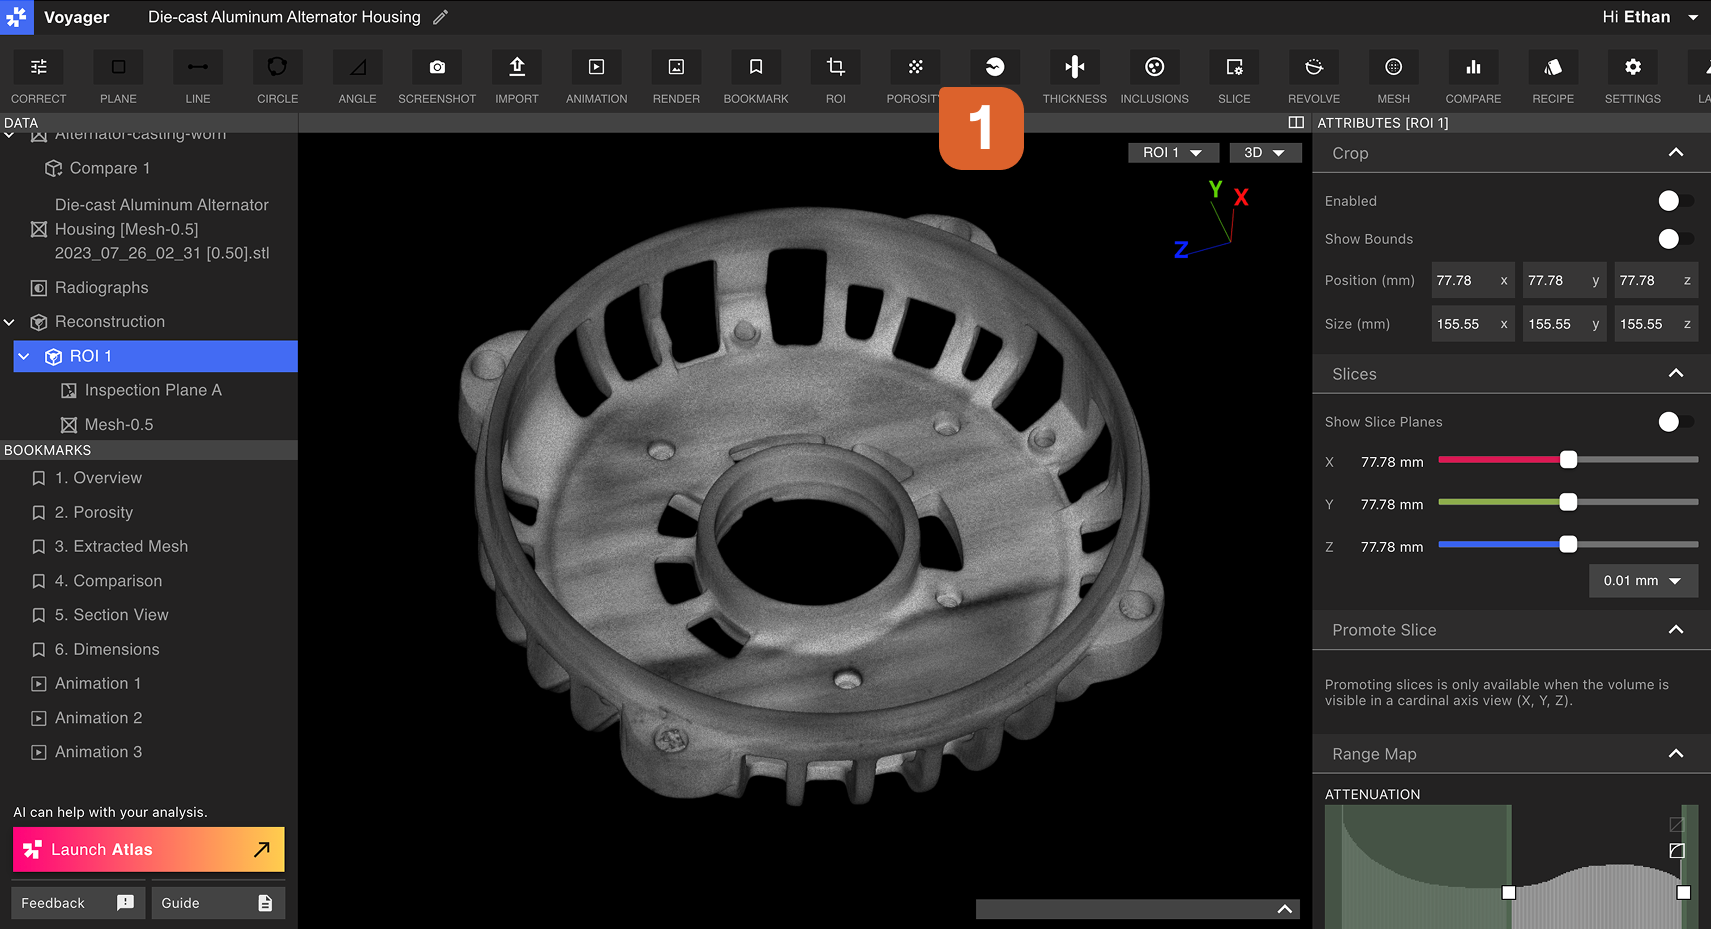
A Porosity Analysis can be created for any Reconstruction or ROI. To open the Porosity Analysis Workflow Editor, select the parent Data Object from the Data Panel, and then select the Porosity Tool from the Toolbar.
 Select desired settings within the Porosity Workflow Editor on the right Panel.
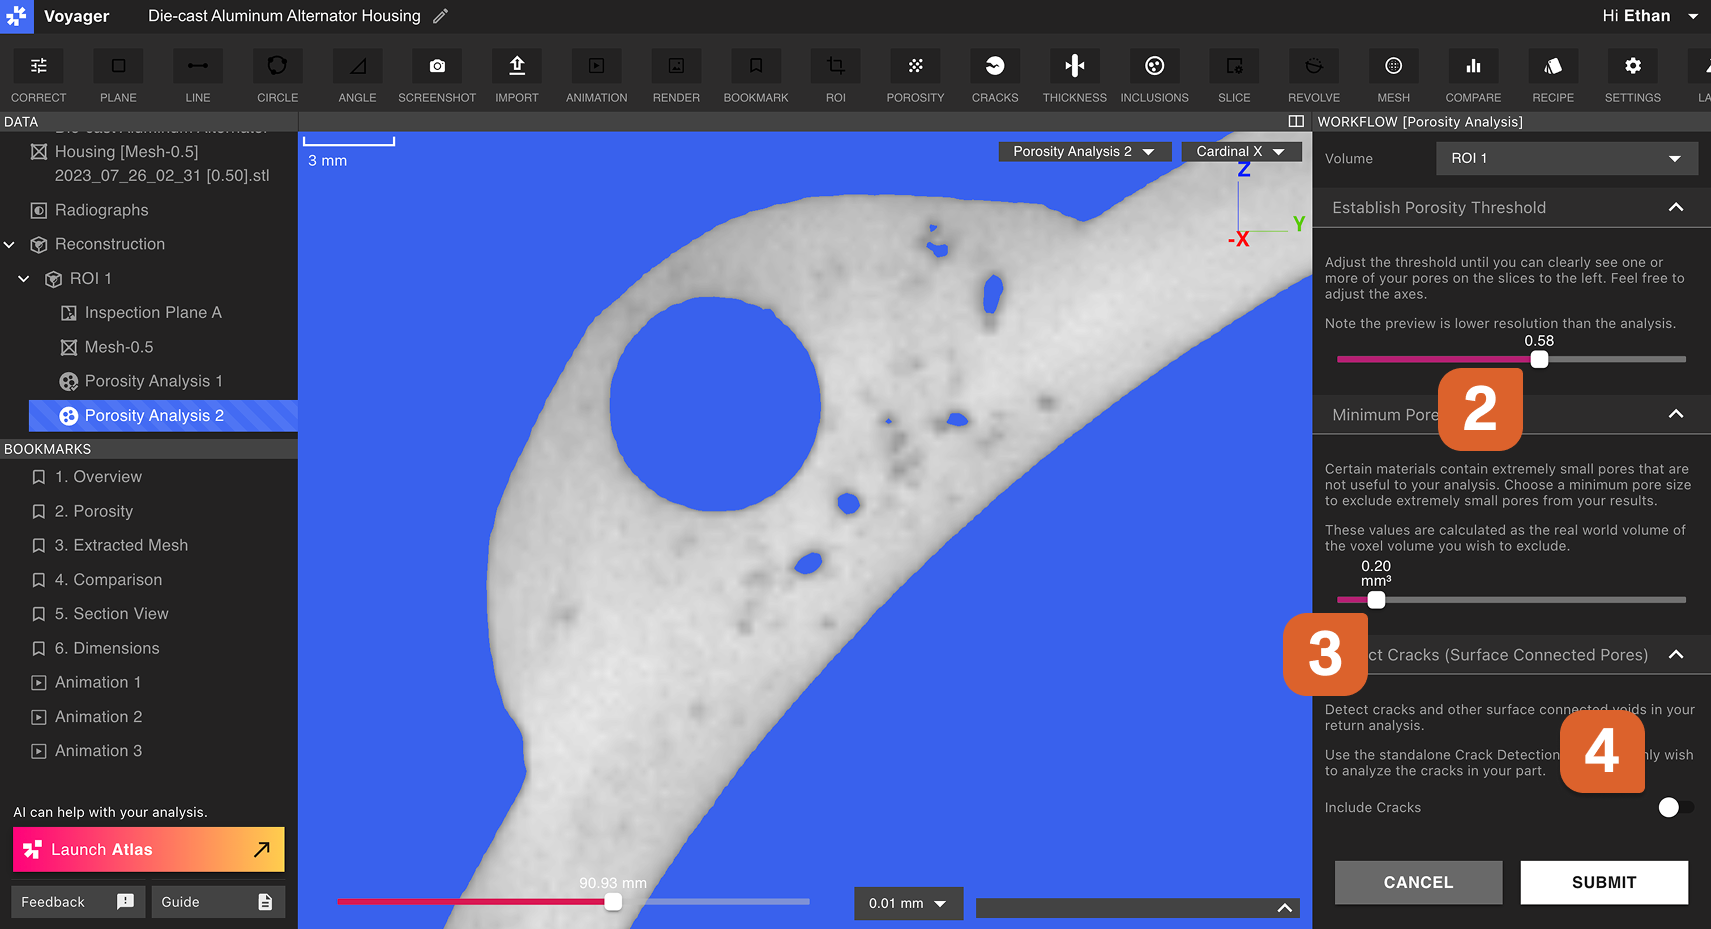 Establish Porosity Threshold: Specifies the maximum attenuation of a region that can be considered a pore. To produce a Porosity Analysis with a more sensitive pore detection (more pores), increase the Porosity Threshold; to produce a Porosity Analysis with less sensitive pore detection (fewer pores), decrease the Porosity Threshold.
Minimum Pore Size: Only pores with a volume above this value will be produced in the Porosity Analysis. Increasing the minimum pore size may decrease the number of pores produced by the Porosity Analysis Workflow.
Establish Porosity Threshold: Specifies the maximum attenuation of a region that can be considered a pore. To produce a Porosity Analysis with a more sensitive pore detection (more pores), increase the Porosity Threshold; to produce a Porosity Analysis with less sensitive pore detection (fewer pores), decrease the Porosity Threshold.
Minimum Pore Size: Only pores with a volume above this value will be produced in the Porosity Analysis. Increasing the minimum pore size may decrease the number of pores produced by the Porosity Analysis Workflow.
Pores can be excluded from view within a Porosity Analysis Data Object. When in doubt, a low minimum pore size is a safer choice as small pores can be hidden later.
Analyzing Porosity
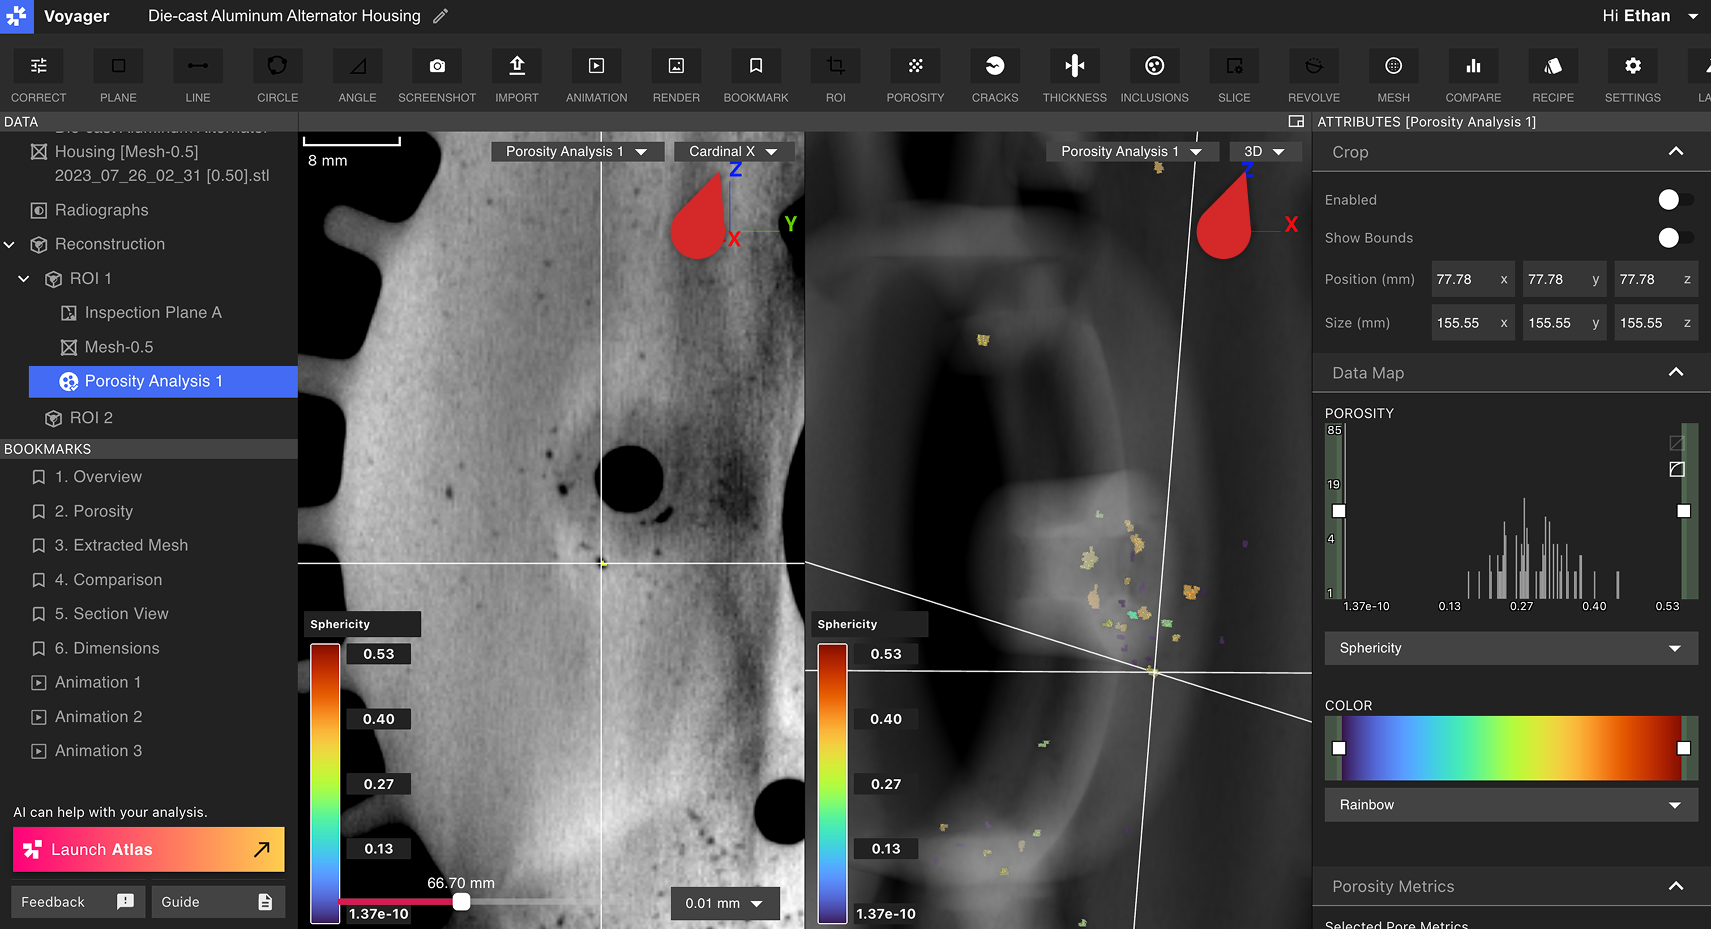
Select a Porosity Analysis Data Object from the Data Panel to begin analyzing Porosity.
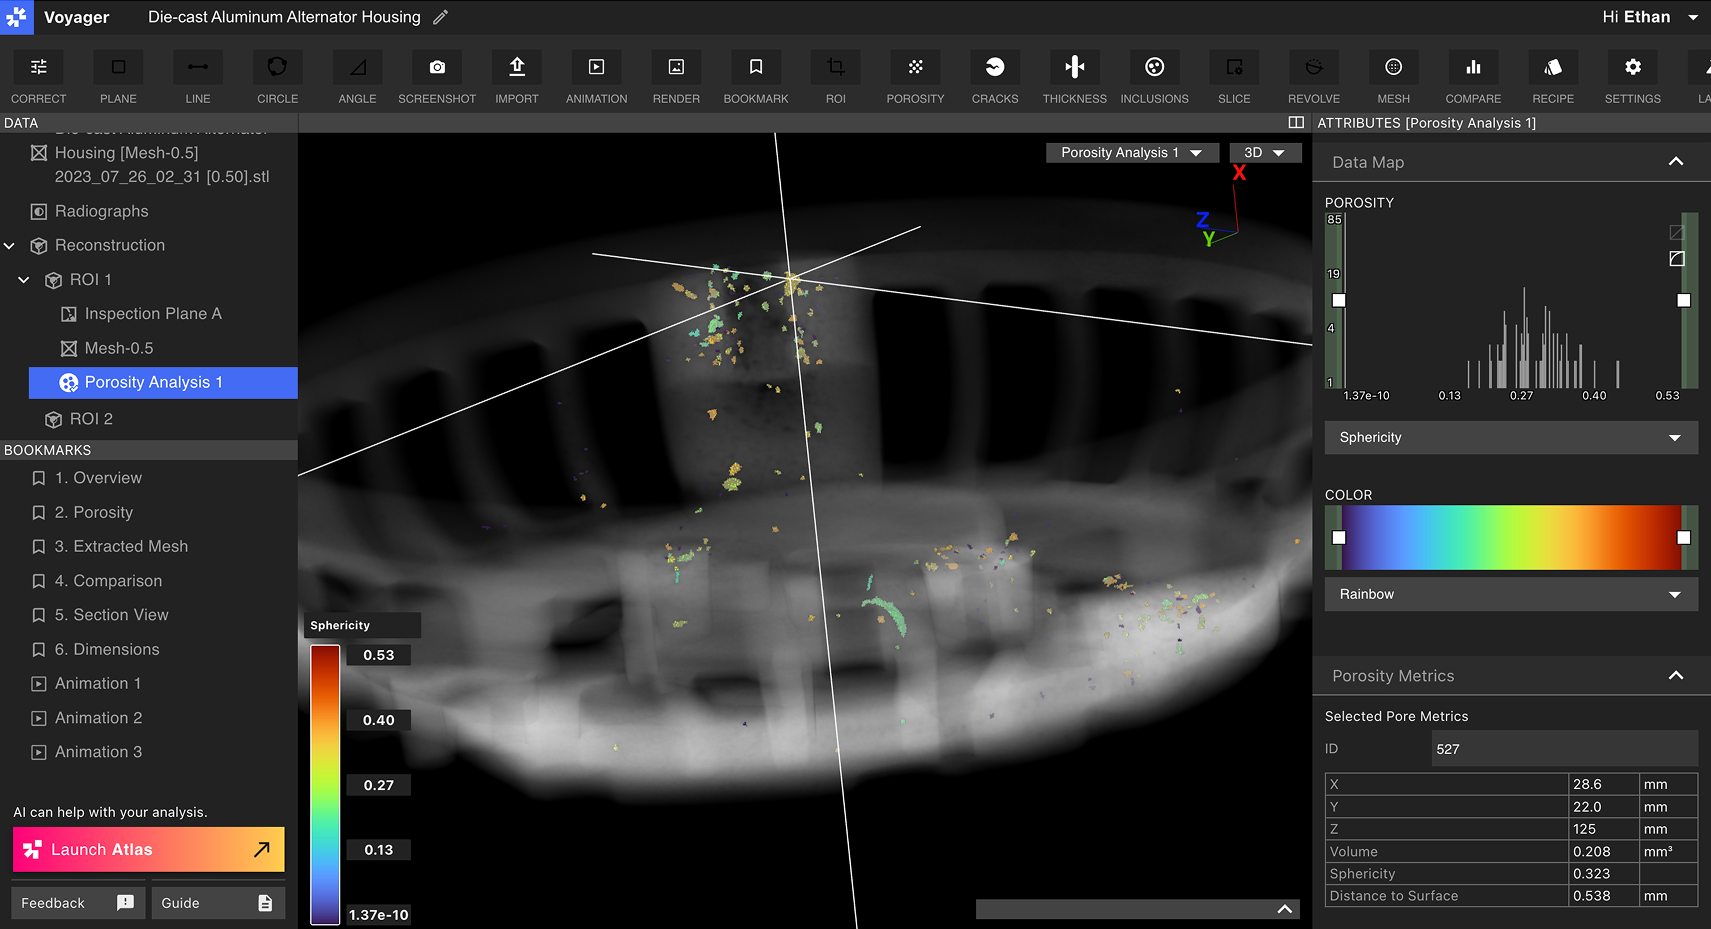
Set view: Choose a 2D or 3D view from the dropdown menu at the top-right of the Viewport.
When the Viewport is split between a 2D and a 3D view, selecting a pore in the 3D view automatically cuts the 2D view to the slice on which that pore lies.
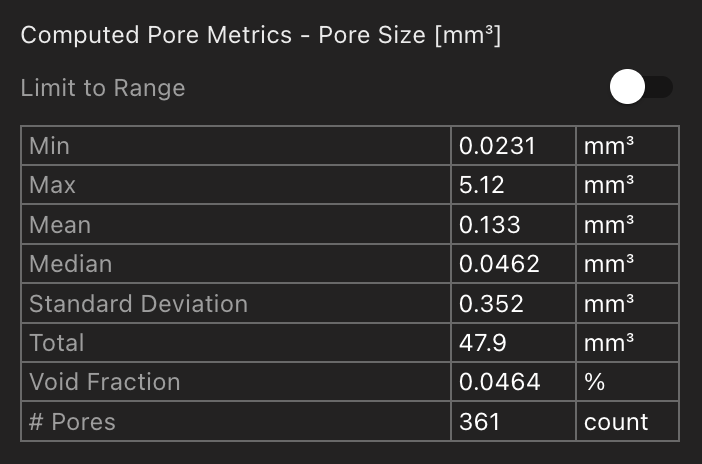
 Computed Pore Metrics: Metrics on all pores produced by the Porosity Analysis display within the Attributes Panel. Limit these metrics to pores that match the currently-selected property filter (see below) using the Limit to Range toggle.
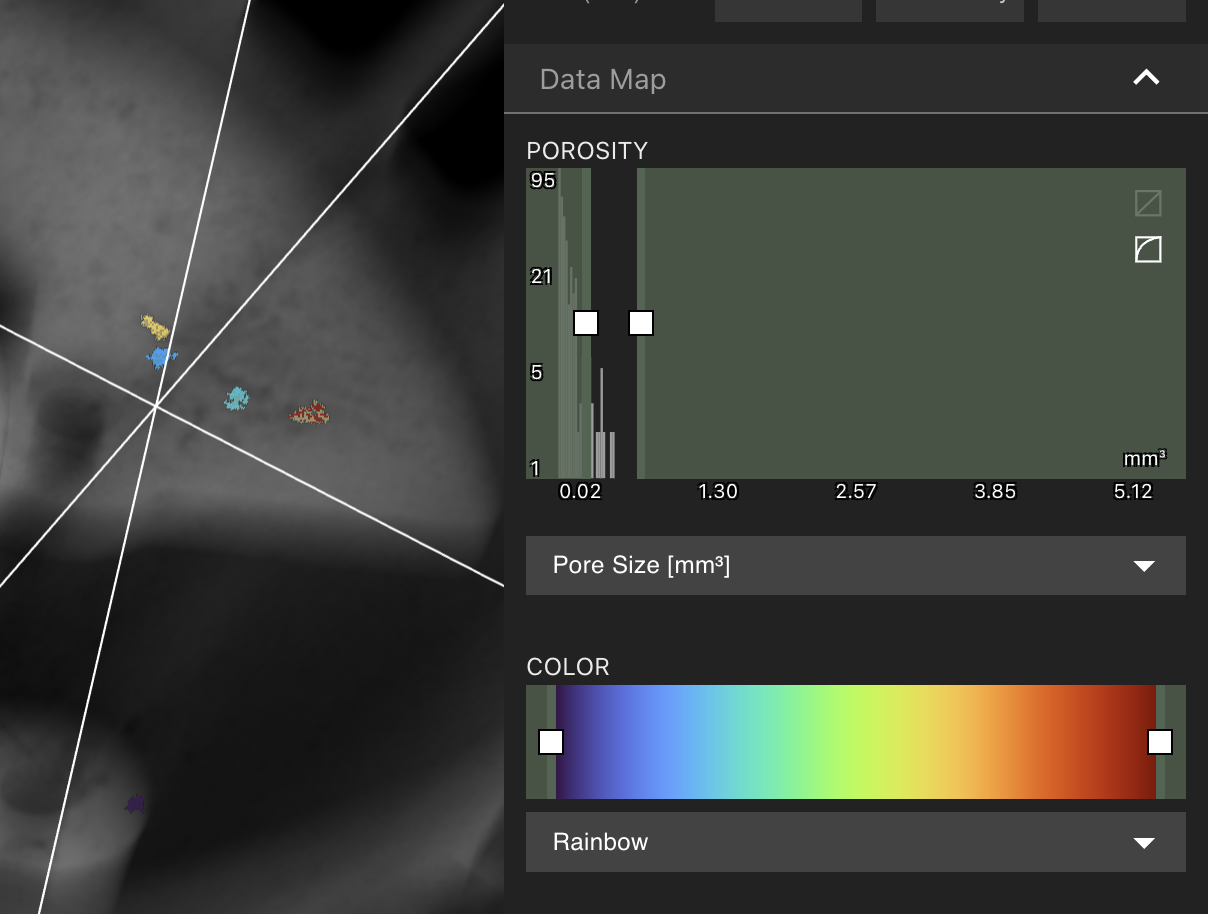
 Data filtering and customization: Customize the data that is shown in the Viewport from the Attributes Panel. Use the Data Map Tab to choose a metric by which pores are displayed: Pore Size, Sphericity, or Distance to Surface.
Pores with high and low values of the currently-selected property can be filtered out of view using the Porosity Graph. Define thresholds of the current property by moving the upper and lower sliders of the Porosity Graph. Only pores falling between the specified range will remain present in the Viewport.
Data filtering and customization: Customize the data that is shown in the Viewport from the Attributes Panel. Use the Data Map Tab to choose a metric by which pores are displayed: Pore Size, Sphericity, or Distance to Surface.
Pores with high and low values of the currently-selected property can be filtered out of view using the Porosity Graph. Define thresholds of the current property by moving the upper and lower sliders of the Porosity Graph. Only pores falling between the specified range will remain present in the Viewport.
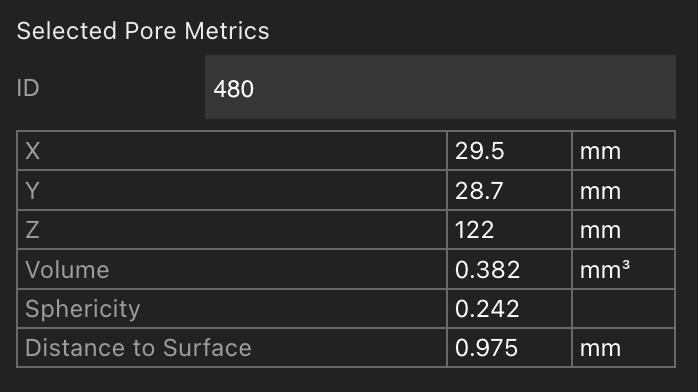
 Single-pore selection: Select a pore in the Viewport to open its individual metrics in the Attributes Panel, including position, volume, sphericity, and distance to surface. A pore can also be selected by searching its ID, which displays when a pore is selected. Select pores by ID to locate specific defects and relate them directly to downloadable analysis reports.