Understanding the Histogram
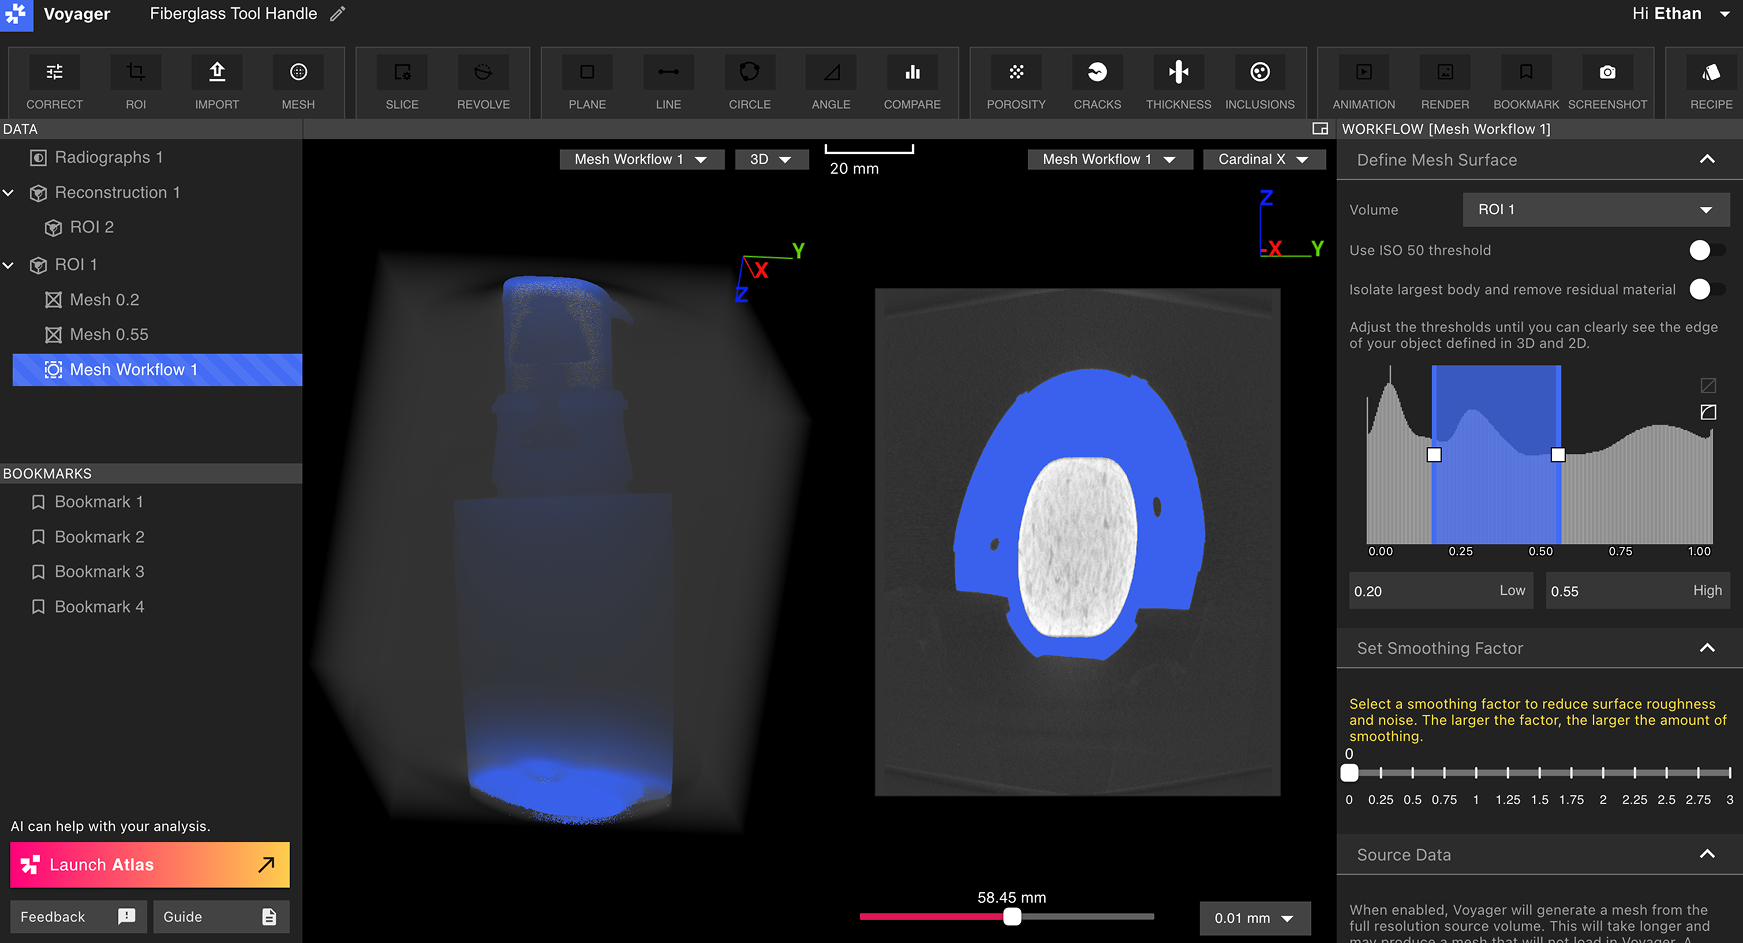
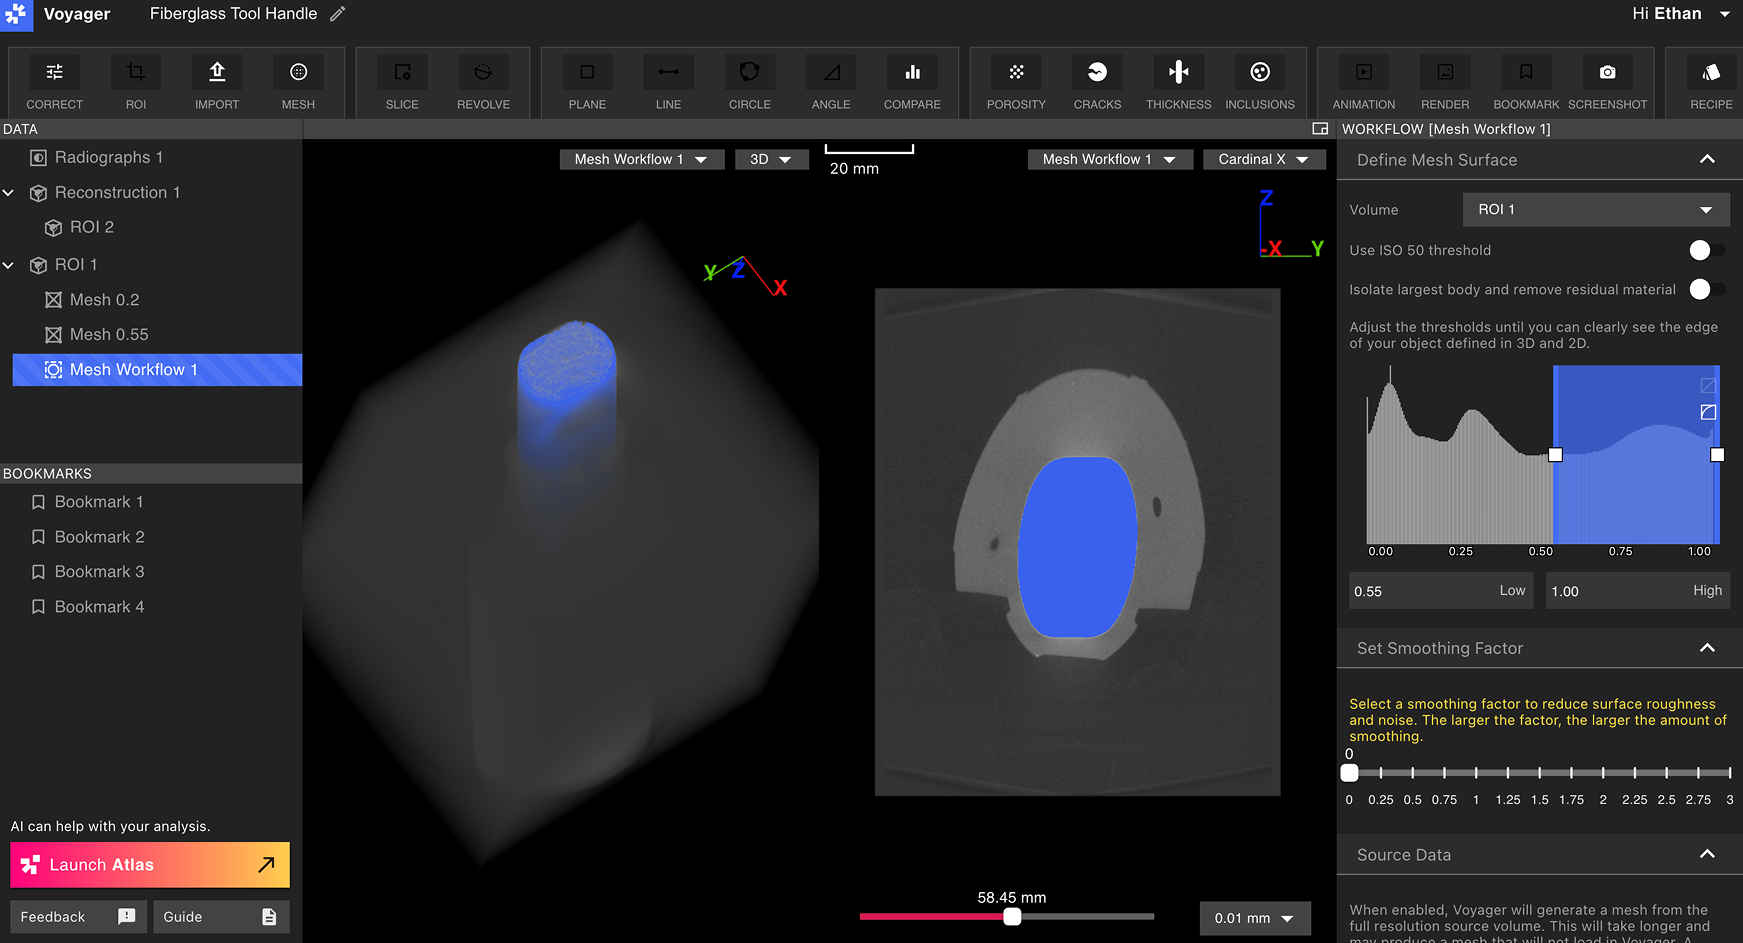
The values selected for a Mesh extraction can be intuited from the histogram seen in the range map of the data object. Thresholds set in the Mesh Workflow Editor correspond to the same value in the range map representing attenuation. Peaks in the range map of attenuation correlate to materials. As such, if you are looking to understand a proper threshold to pick, you typically want to select the value 50% of the way between the material you want to select and the background you want to separate it from.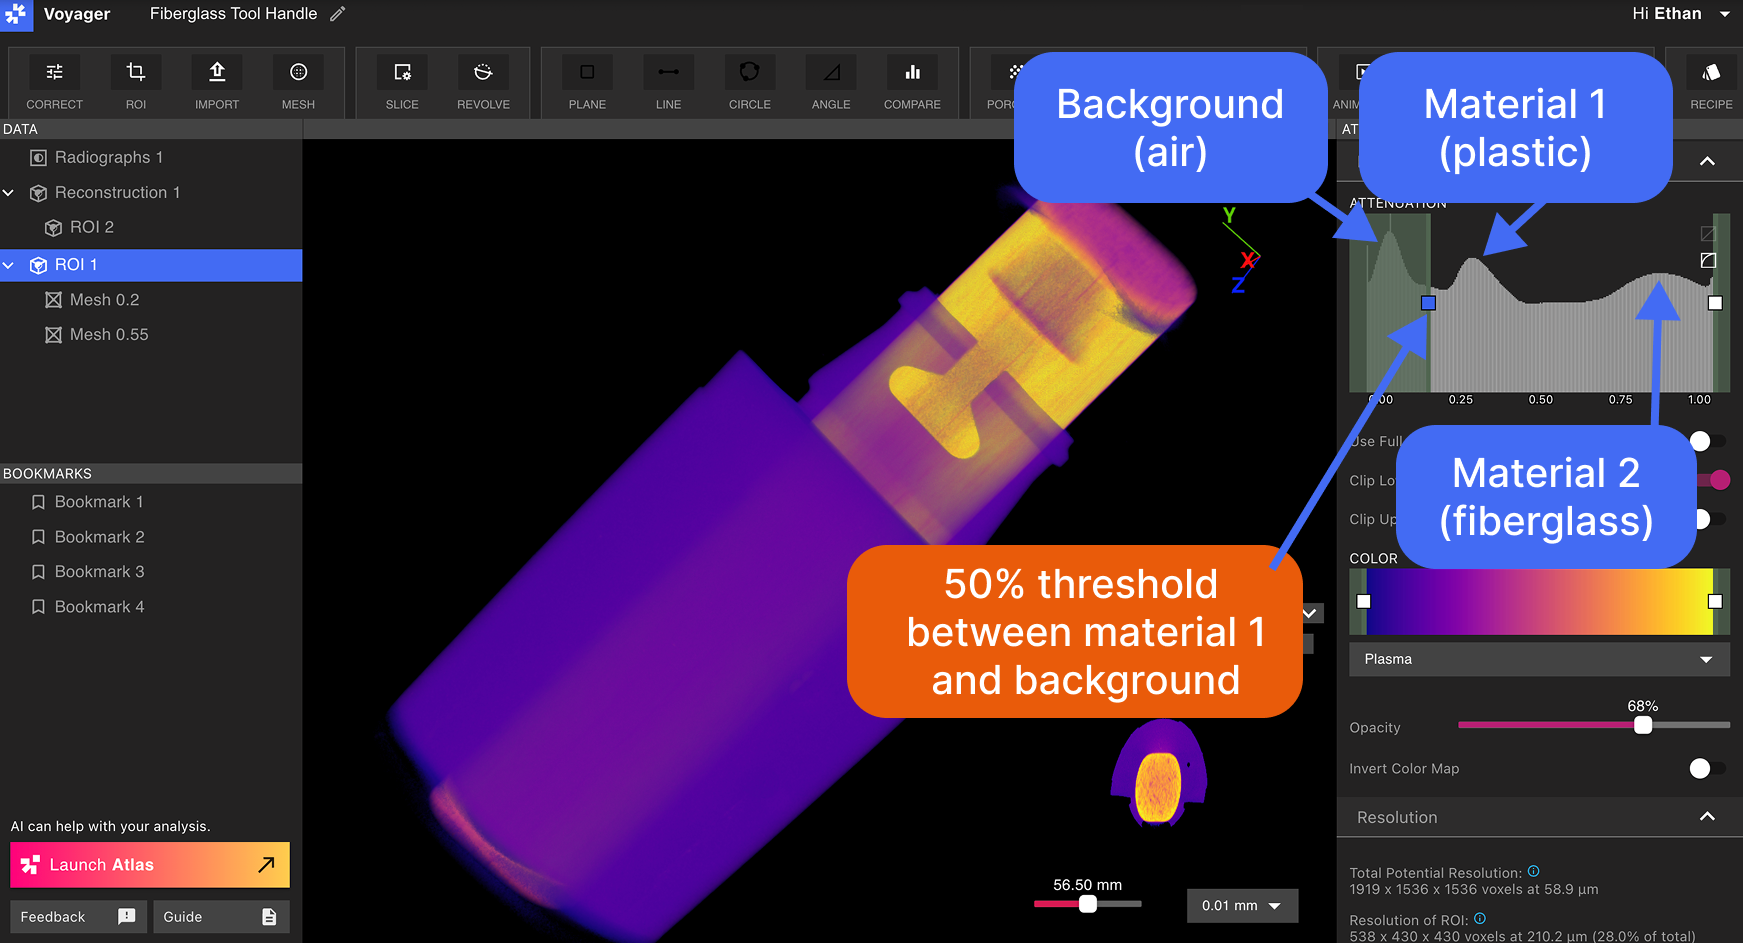
This tool handle is made up of a plastic overmolded to a fiberglass core. Note the material spikes in the range map, and the threshold to provide separation.Select the desired data object from the Data Panel, and select the Mesh Tool.
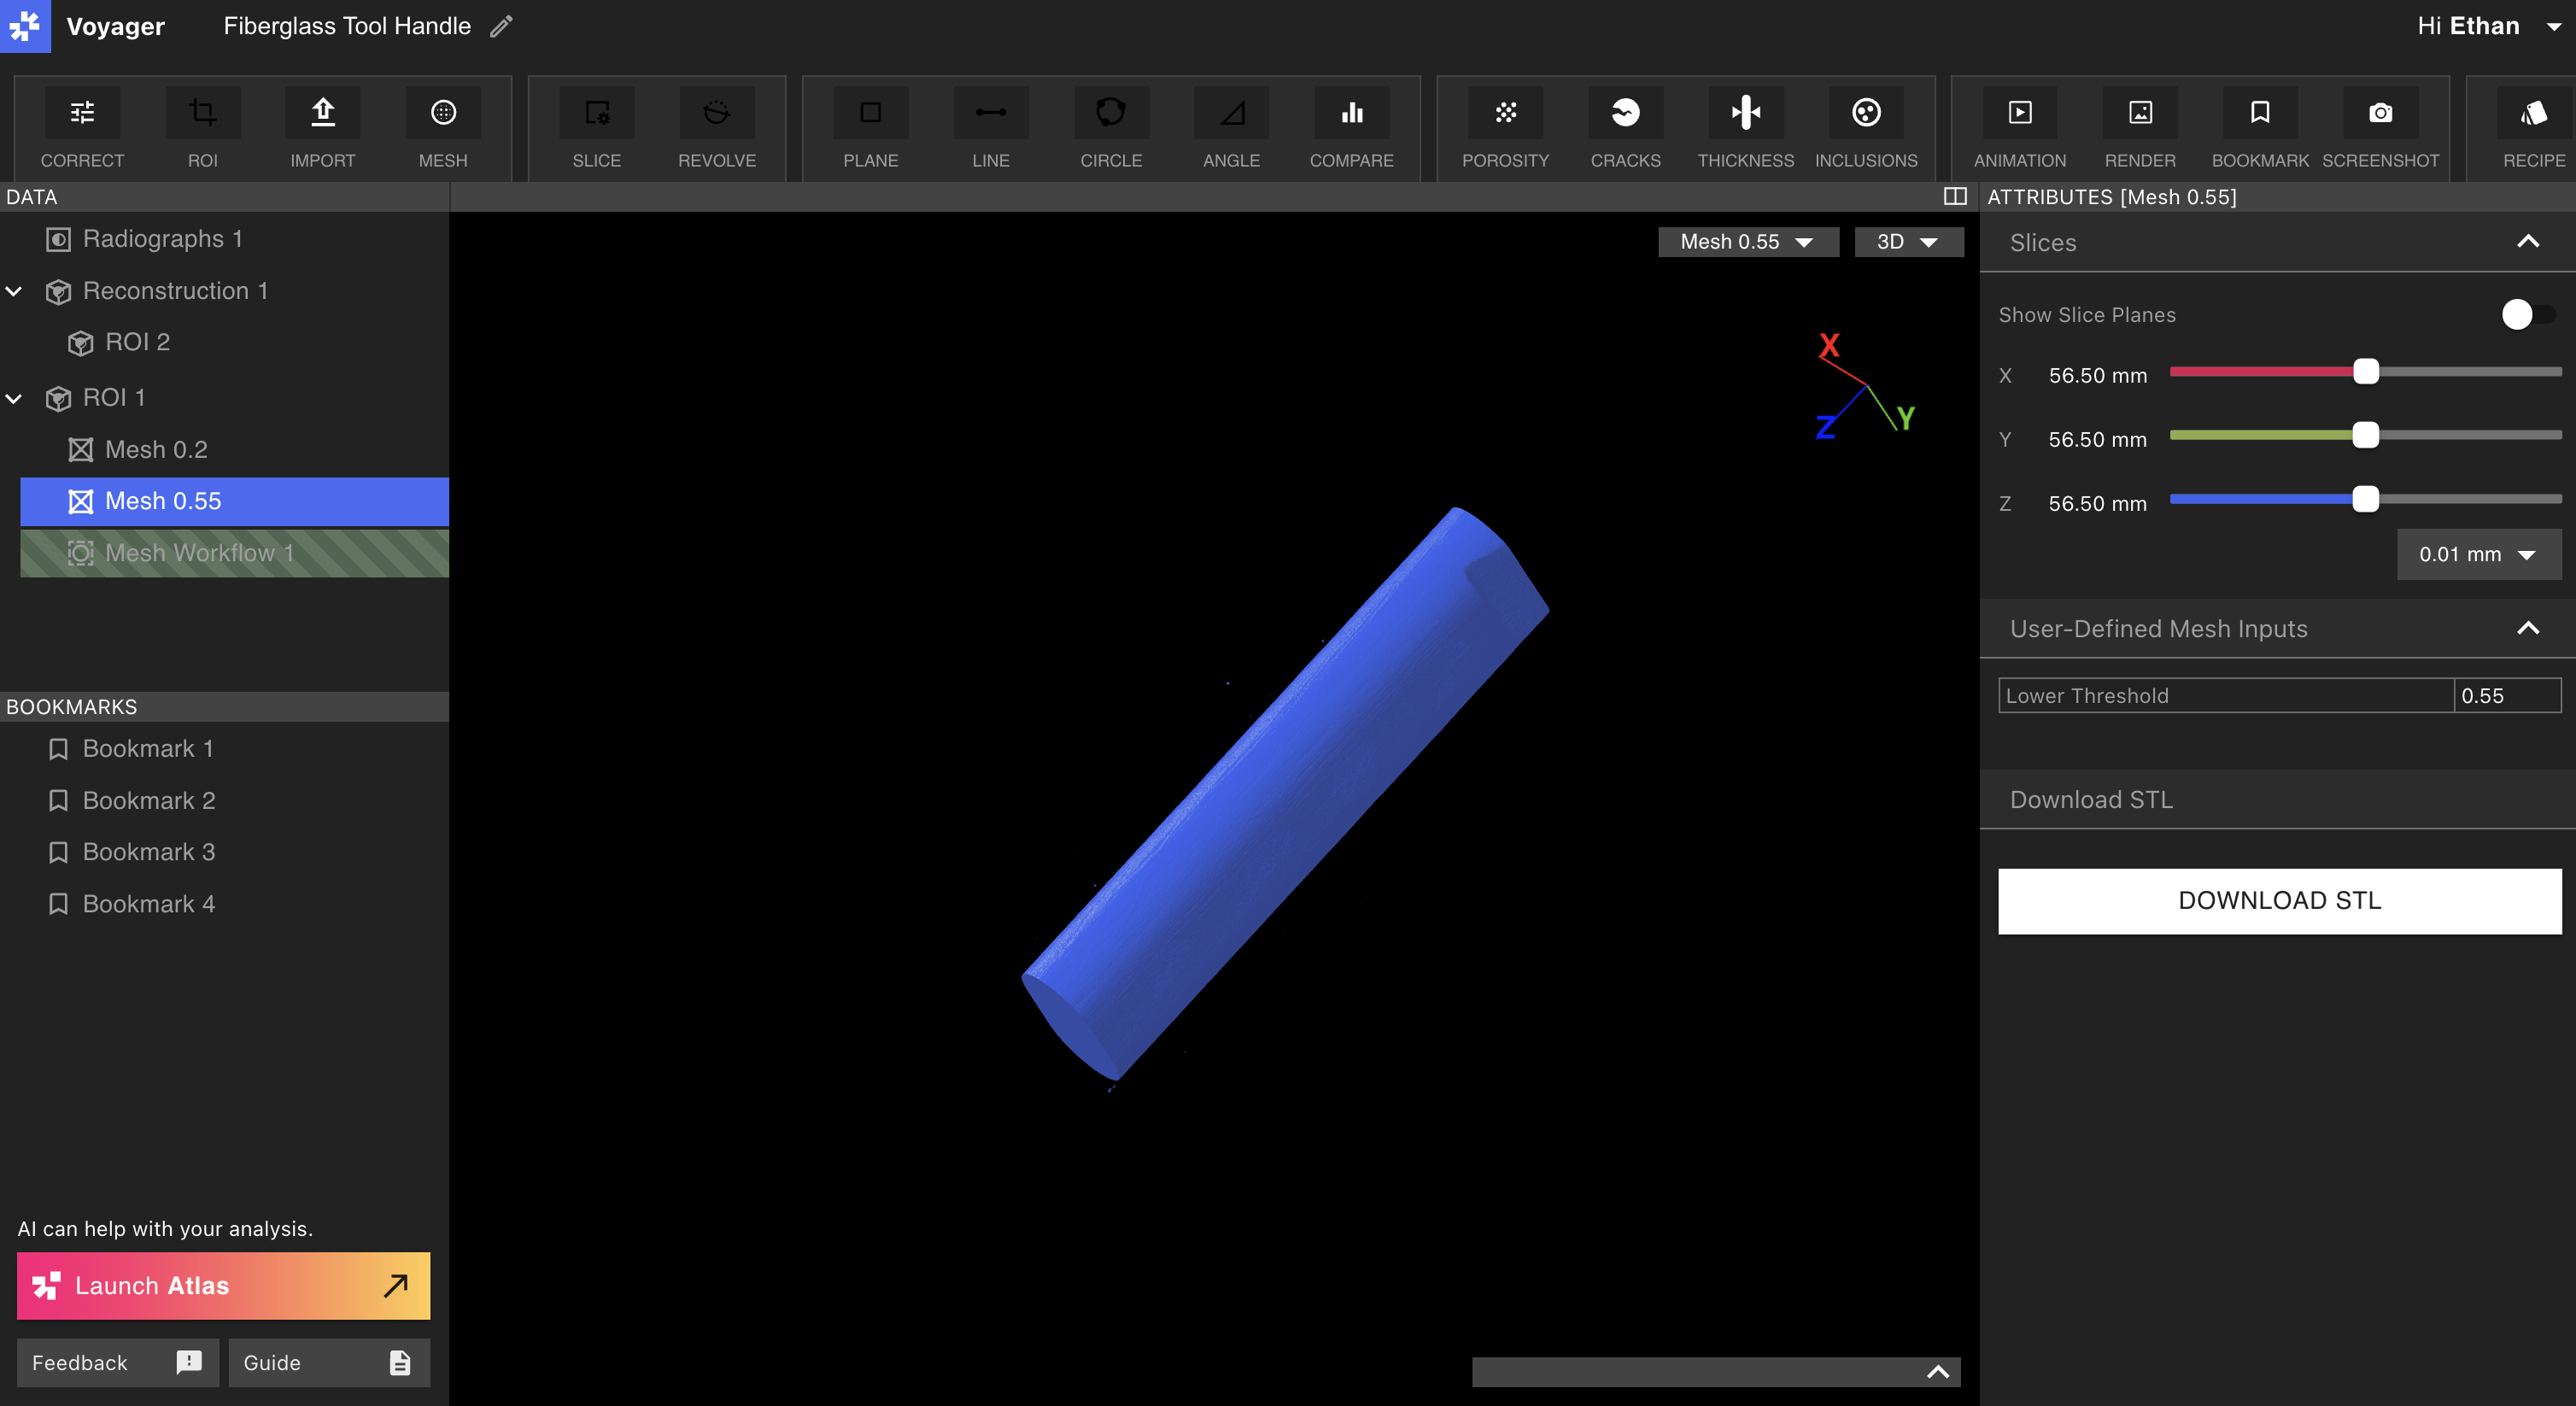
Resulting Meshes
Resulting Meshes will represent single materials within the part.Name Meshes based on the Mesh threshold or component material.