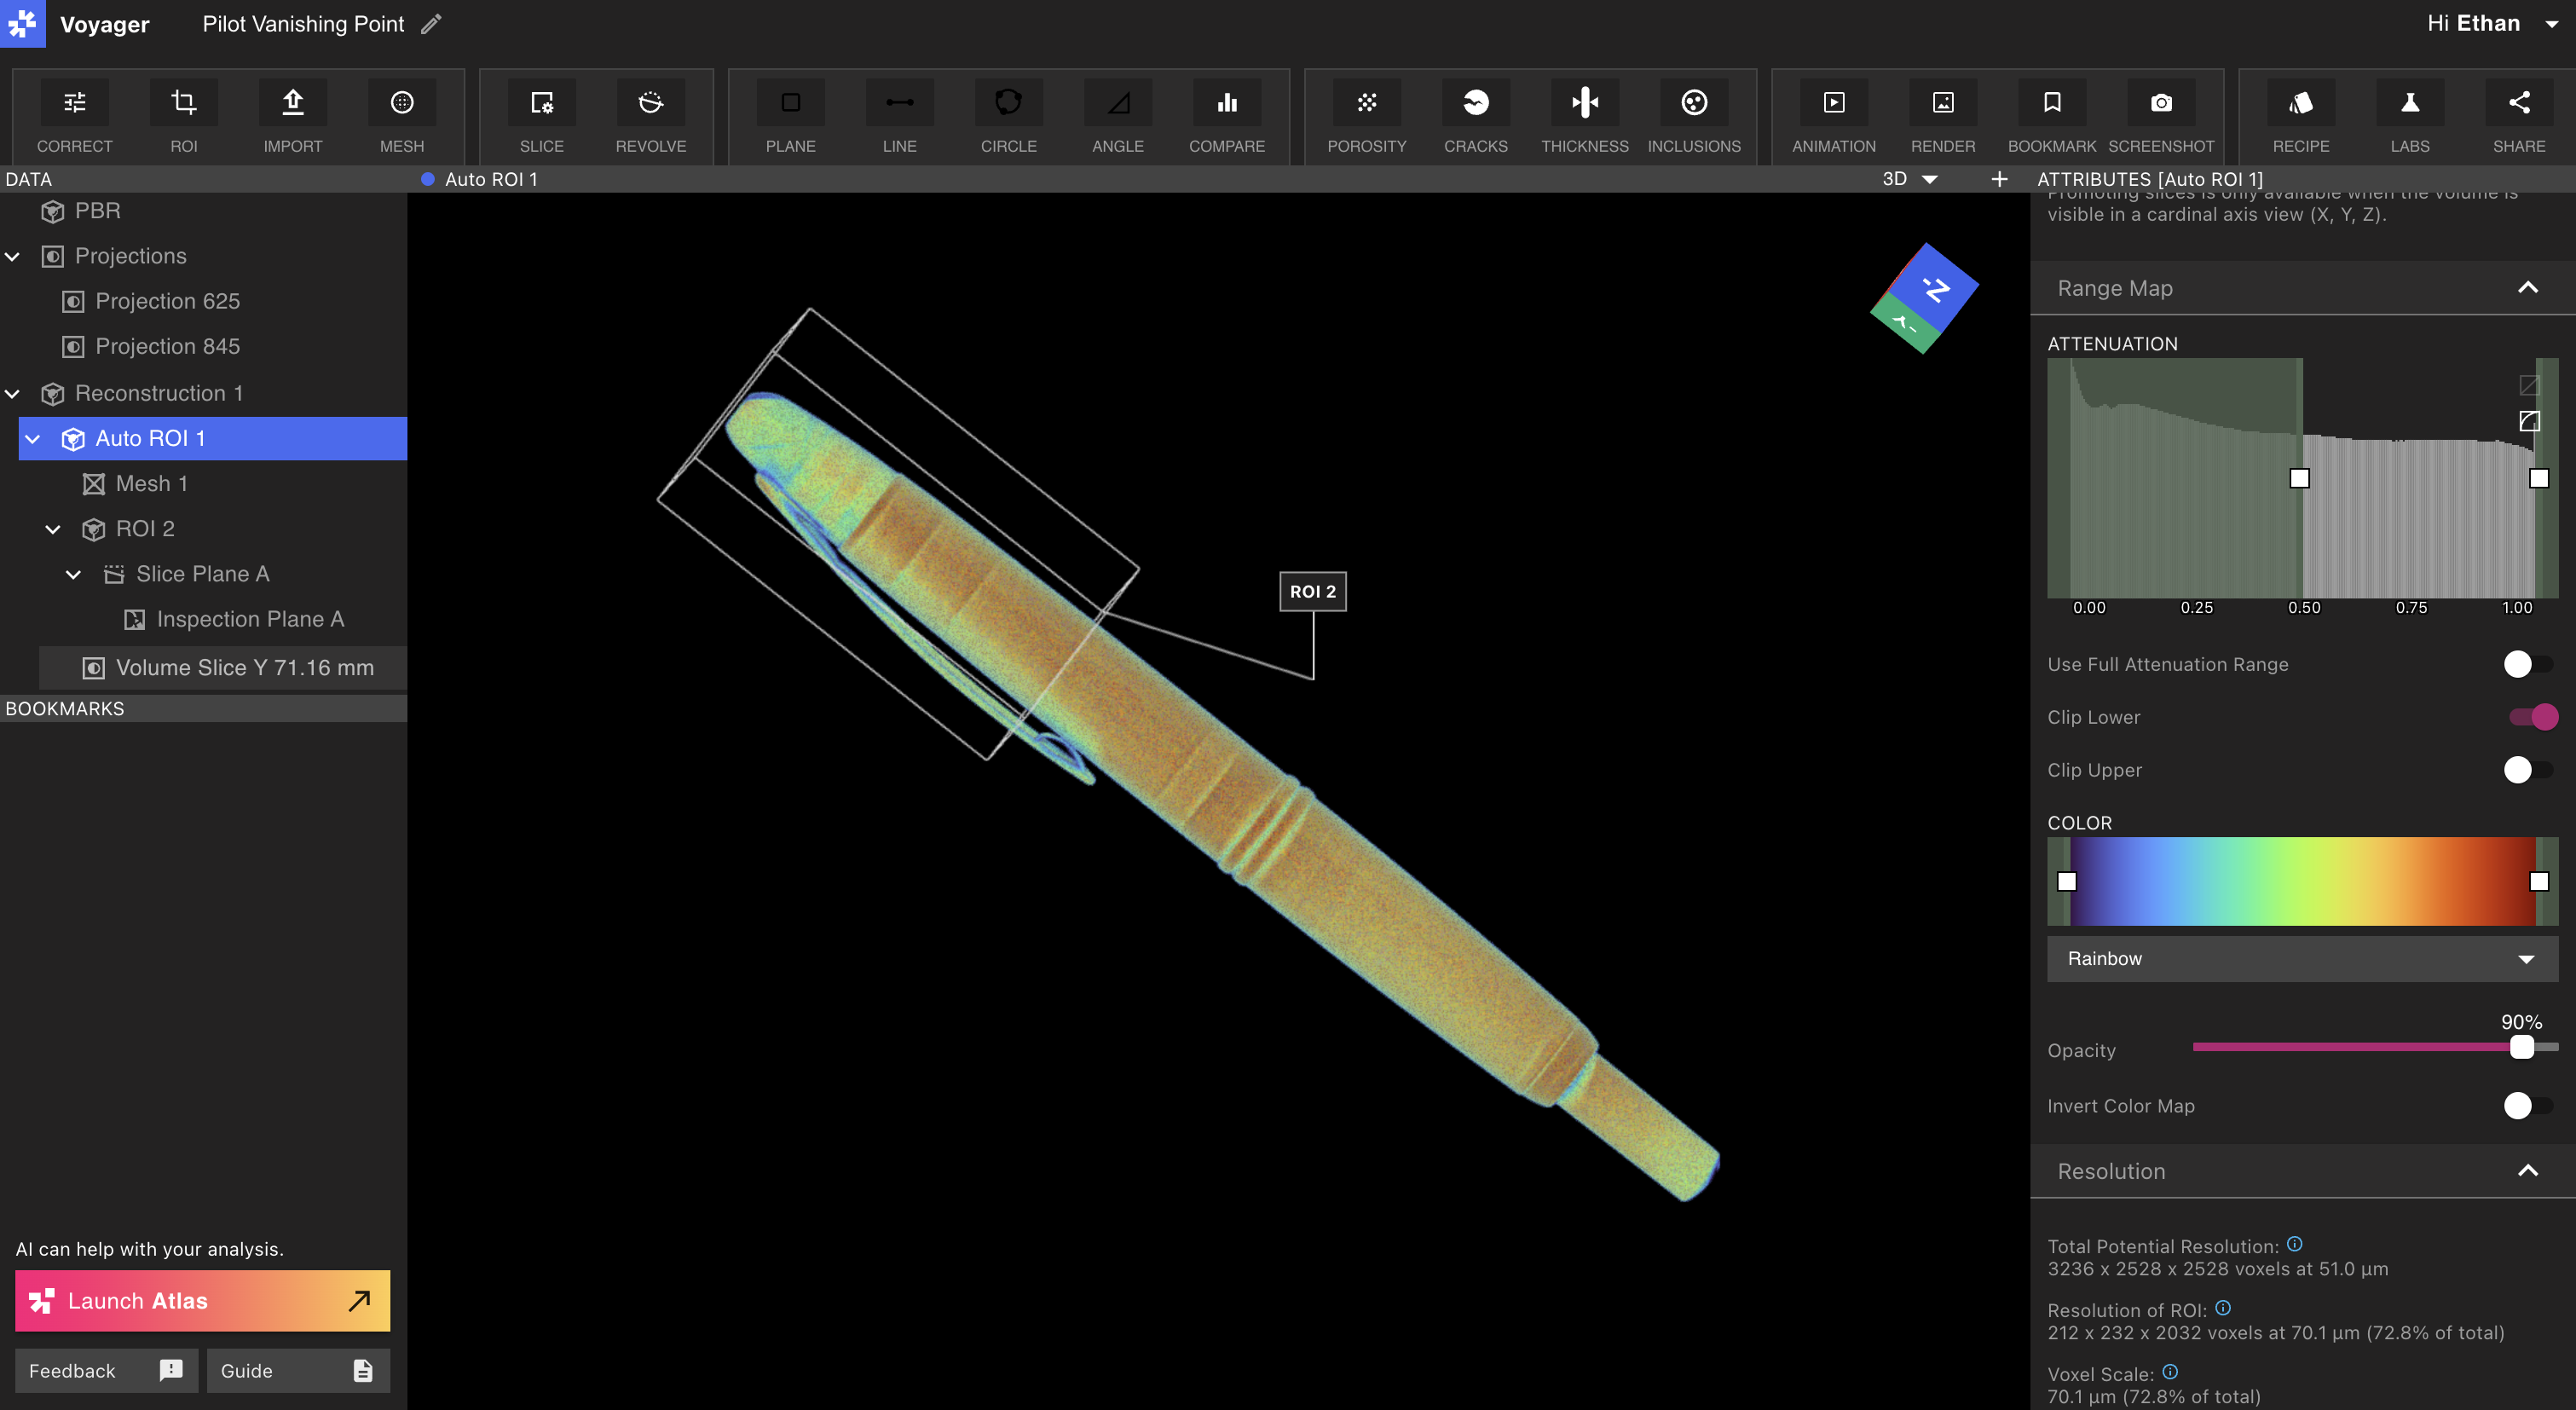
Viewport
The Viewport occupies the majority of the Project Editor and displays selected scan data.Viewport layouts
The central panel of Voyager can be configured to display either a single Viewport or two split Viewports. By default, Voyager’s central panel displays a single Viewport. Single Viewport: Use a single Viewport to view one data object at large dimensions on your screen. Change the current object by selecting a data object from the Data Panel. Split Viewport: Open a second Viewport to view two data objects, or different views of the same data object, side-by-side. Select the ”+” icon at the top-right of the Viewport to toggle from single Viewport into the split Viewport layout.Viewport focus (new!)
In the split Viewport layout, a single Viewport remains focused at a time, as indicated by a highlighted bar at the top of the Viewport (“Mesh 1” in the below image). The Attributes Panel, on the right side of Voyager, displays the attributes of the focused Viewport.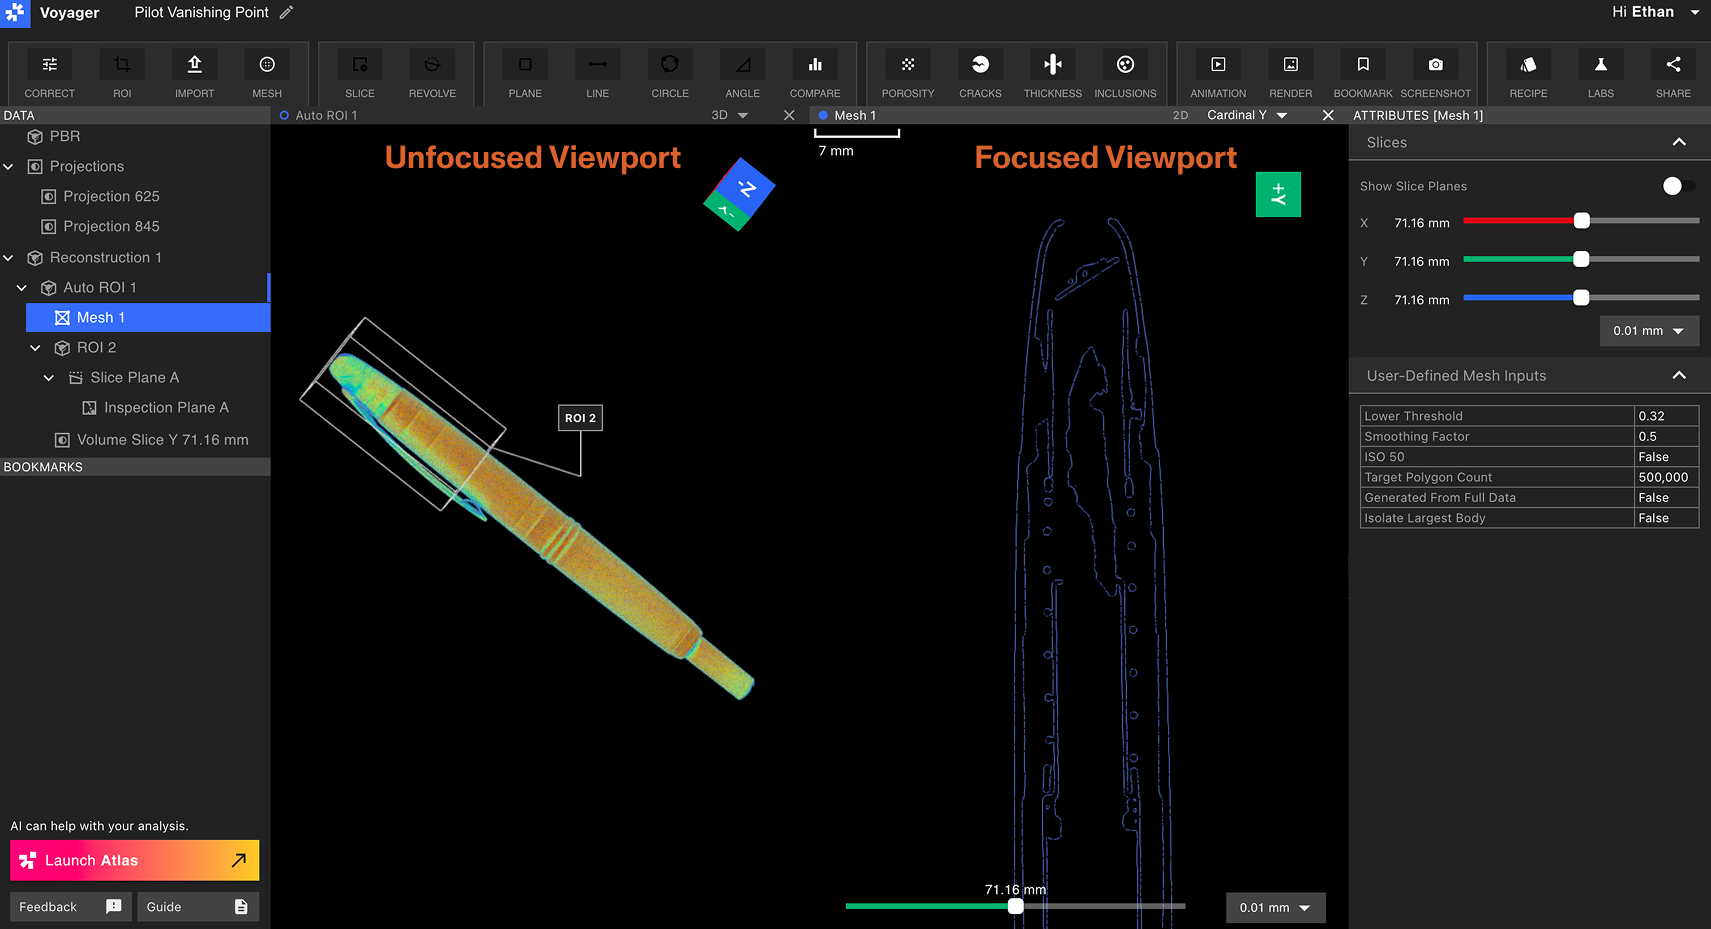
2D and 3D views
When a Reconstruction, ROI, Slice Plane, Mesh or Analysis Results Data Onject is selected, 2D and 3D modes can be toggled using the dropdown in the top-right corner of the Viewport panel.2D views
In 2D views, users can pan, scrub and zoom. 2D views include the default X, Y, and Z cardinal axes, along with any Slice Planes created within the Project. Click and drag within the Viewport to pan. Use mouse or trackpad controls to zoom in and out. Use the slider below the Viewport to scrub through slices of a 2D view. The adjacent dropdown changes the slice precision, and the scale bar at the top-left represents the scale of the data in view.
3D views
In 3D views, users can rotate, pan and zoom. Rotate by clicking and dragging within the Viewport, pan by using right click + drag within the Viewport, and use mouse or trackpad controls to zoom in and out.Viewcube
When clicking-and-dragging in the Viewport to orbit the part, the Viewcube orbits to match the part’s current orientation. The Viewcube also includes controls to choose a desired orientation of your part with precision.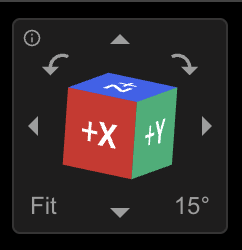
Data Panel
The Data Panel appears on the left side of the Project Editor below the label “Data”. Each item in the Data Panel represents a data object, which can be one of the following: Projections, Reconstruction, ROI, Plane, or Analysis Results. Learn more about data objects on the Data Objects + Workflows article.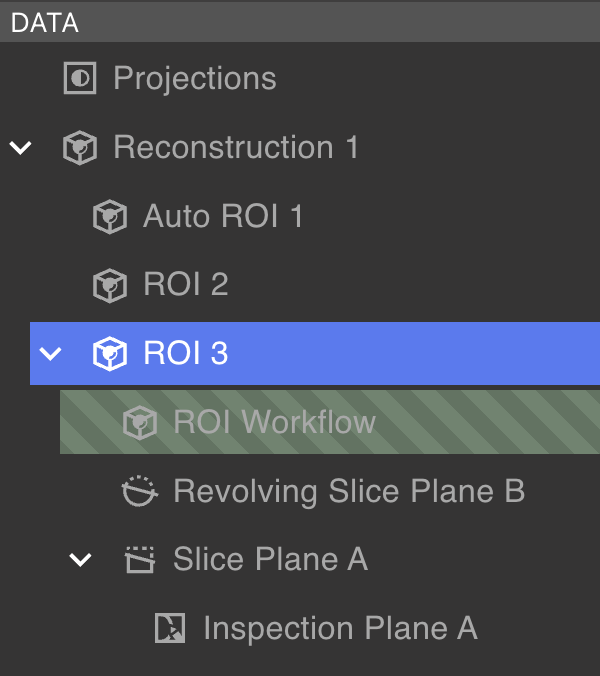
Data Panel controls
Right-click a data object to delete or rename it.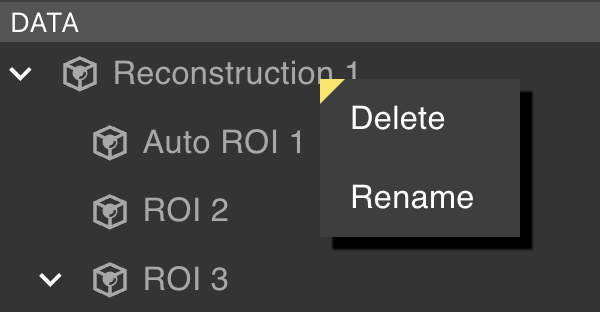
Data objects with children cannot be deleted. Delete all child data objects before deleting the parent.
Bookmarks Panel
The Bookmarks Panel is located below the Data Panel. It contains Bookmarks, Renders, and Animations. Right-click any item to delete, rename, or copy a link to a Bookmark Object. A collaborator must have Project access to view a shared Bookmark link.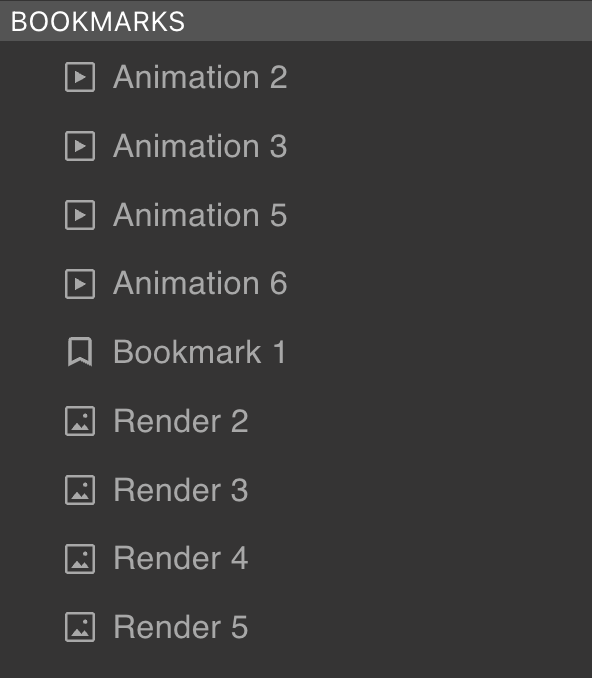
Toolbar
The Toolbar appears at the top of the Project Editor. Tools available for the selected data object are highlighted; unavailable Tools appear greyed out as some Tools function only on specific data object types.
- Create a new data object
- Create a new Bookmark object
- Display new attributes in the Attributes Panel
- Open a Workflow Editor
Attributes Panel
The Attributes Panel on the right side of the Project Editor displays attributes and visualization settings for the selected data object. Available attributes vary by data object type.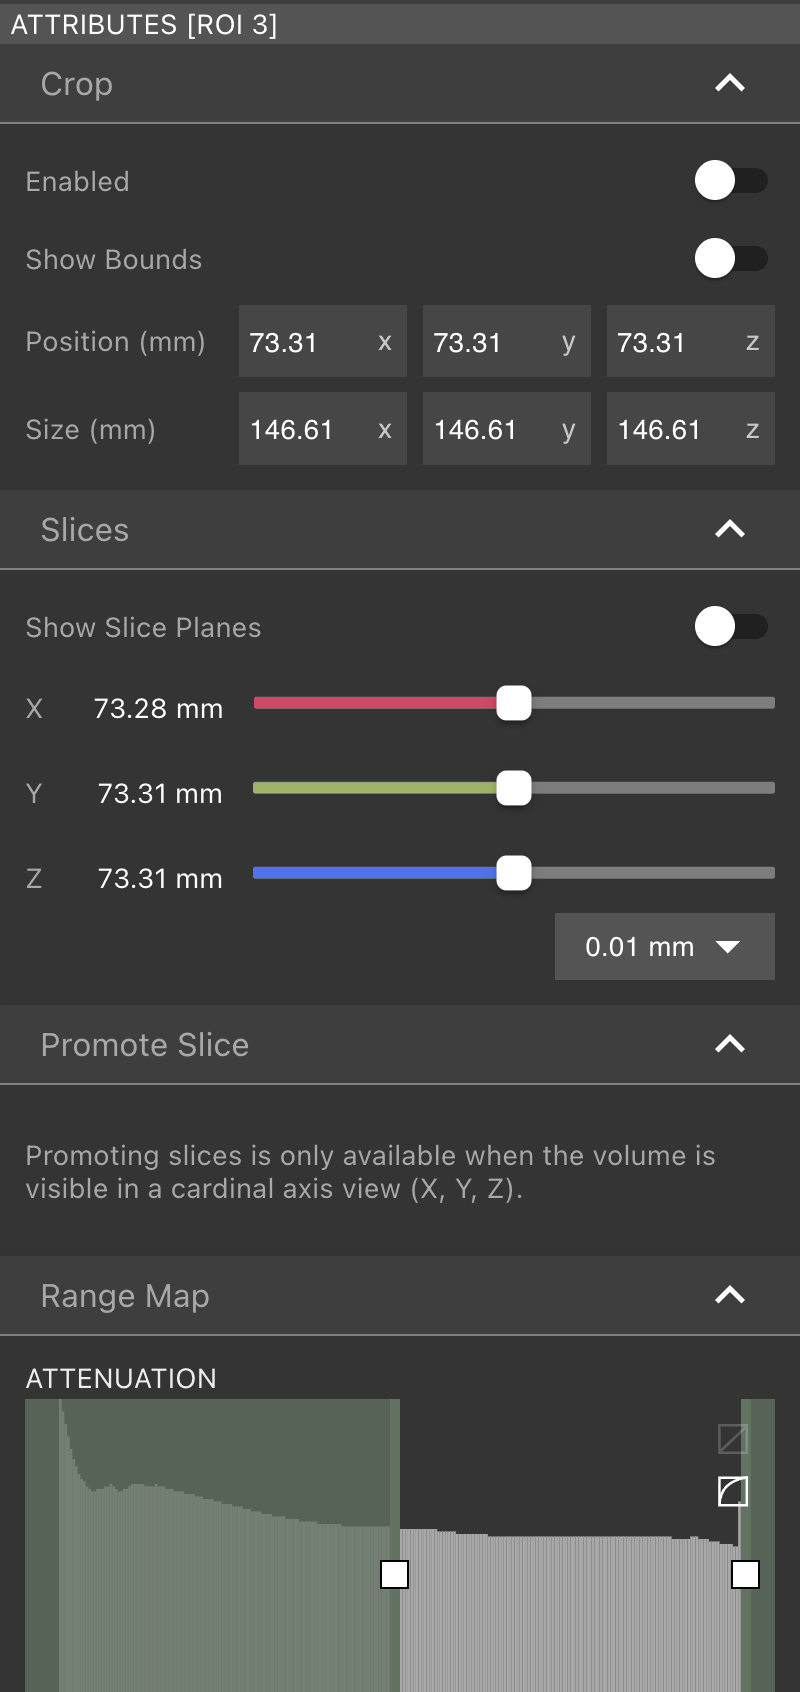
Workflow Editor
When the ROI, Porosity, Cracks, Thickness, or Inclusions Tool is selected, the Workflow Editor replaces the Attributes Panel on the right side of the Project Editor. Users can switch between active Workflows without losing progress.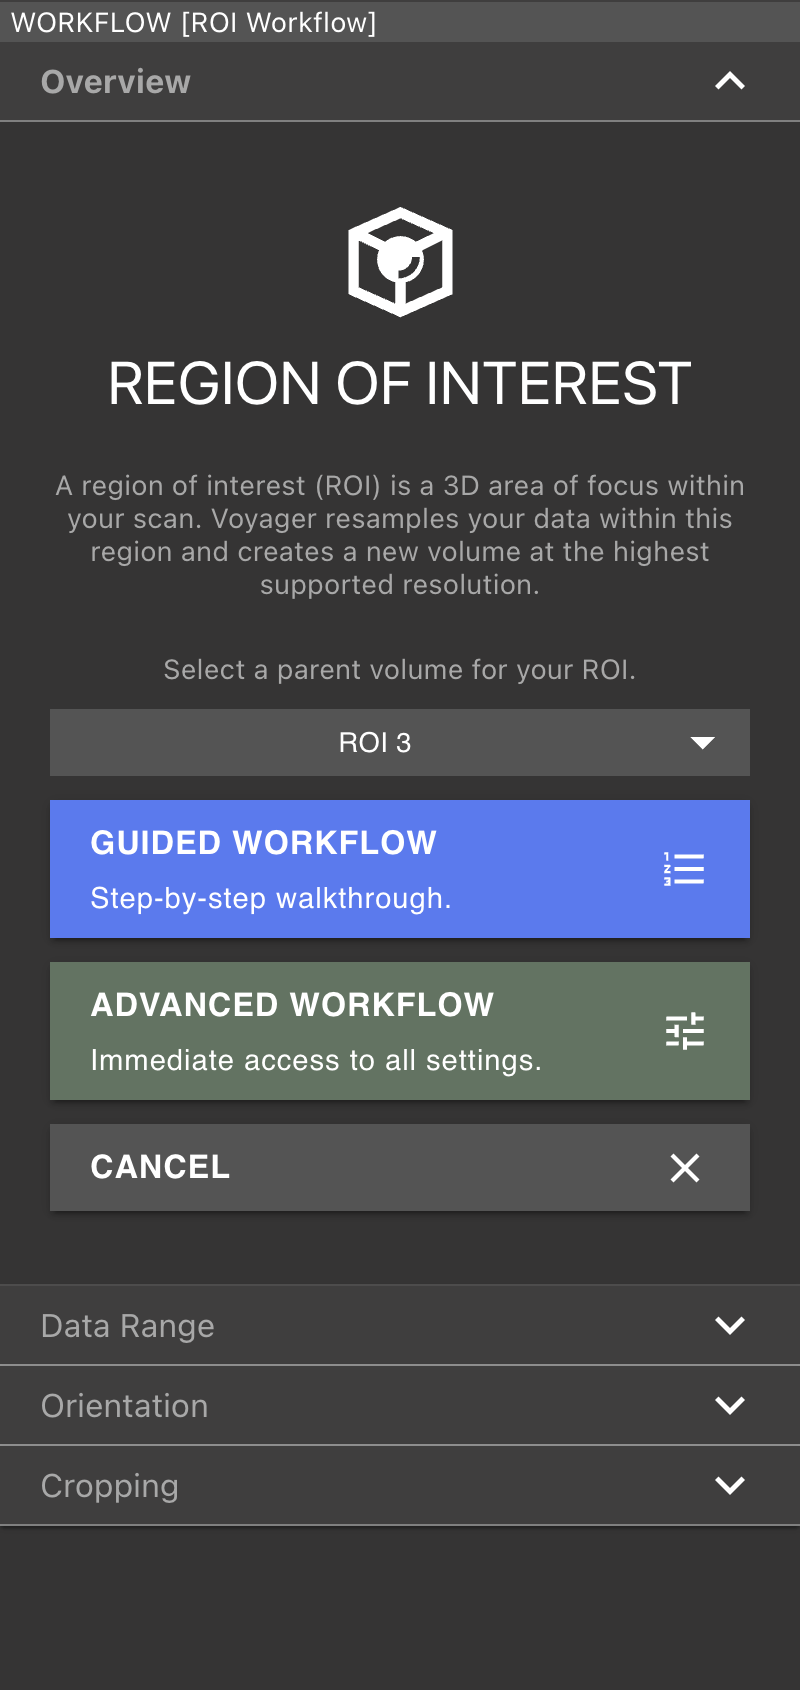
Navigation Bar
At the top-left the Project Editor, tools are available to rename the Project and navigate back to the Project Dashboard.

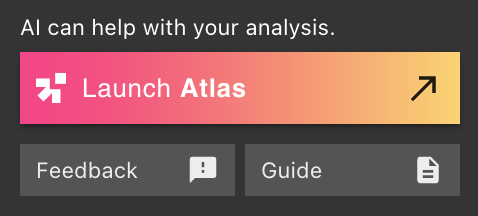
Help Panel
The bottom-left corner of the Project Editor contains controls to launch Atlas, Voyager’s AI assistant; send feedback; and open support documentation.