Projects containing many Data Objects may take longer to load.
Projections
Projects created from a Neptune or Triton scan automatically populate a Voyager Project with a Projections Data Object. This Data Object contains the raw radiographs captured by the detector during the scan. In a radiograph, dark regions represent high attenuation while lighter regions indicate lower attenuation.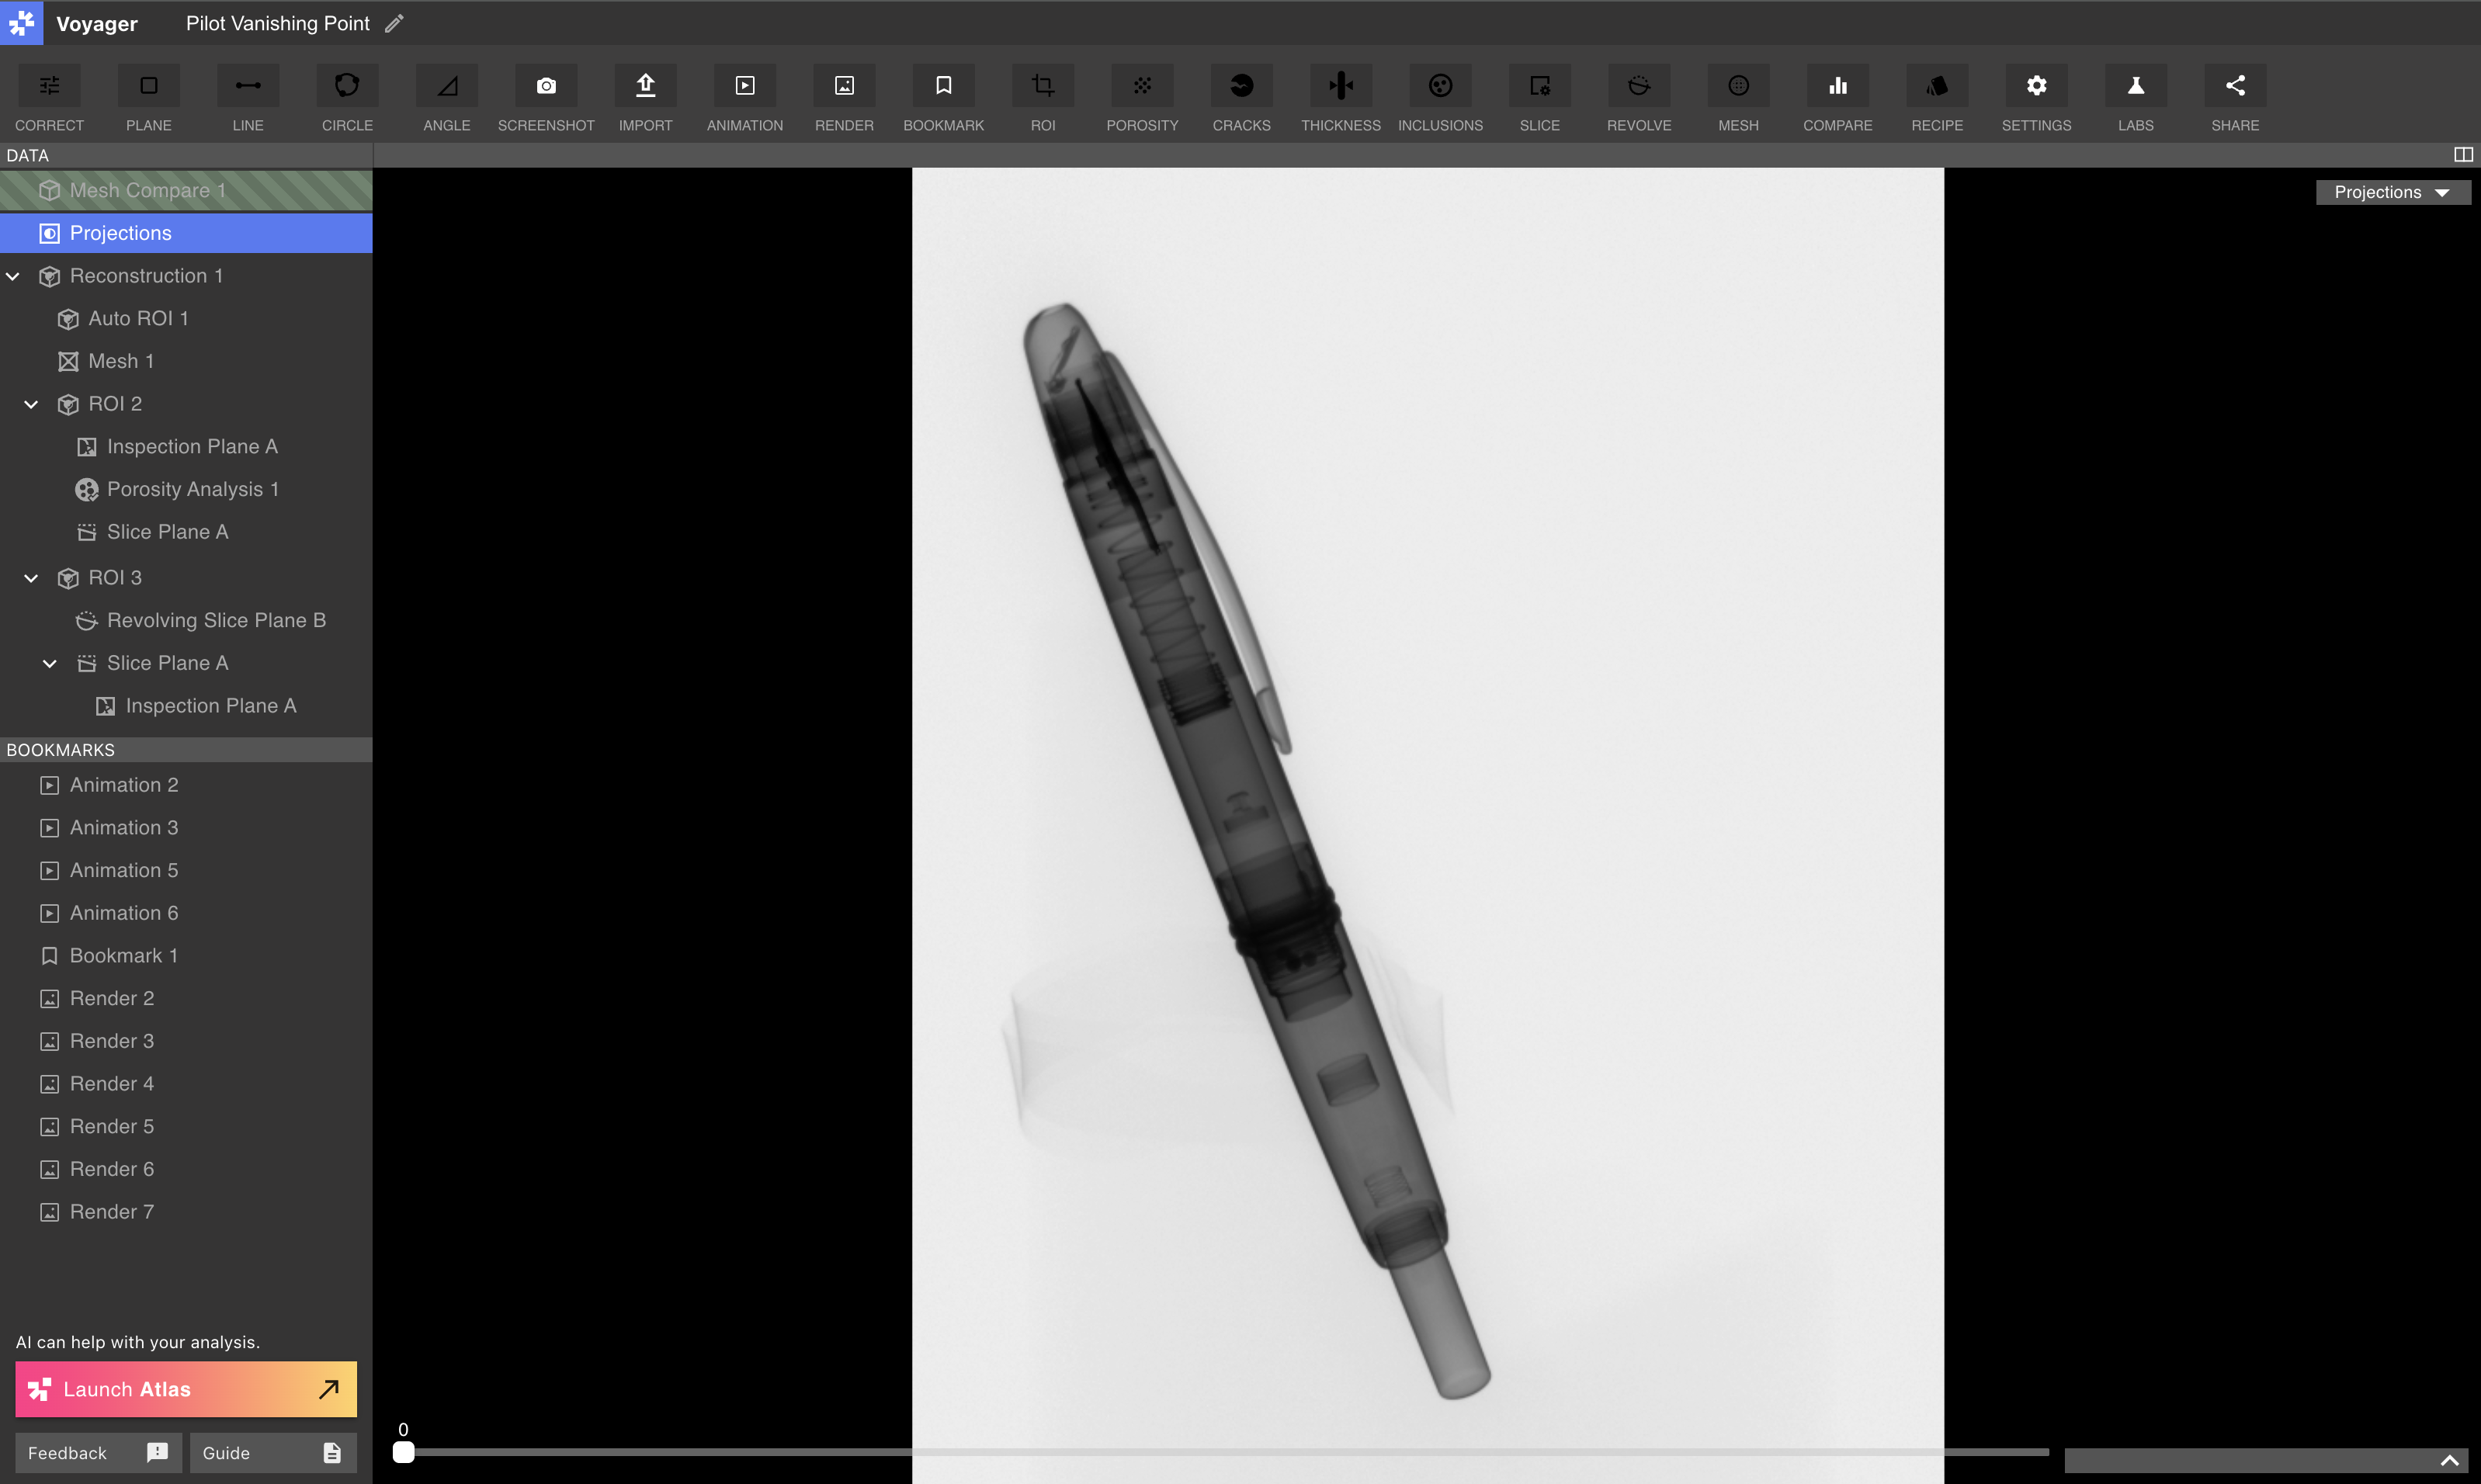
Projections controls
Use the slider at the bottom of the Viewport to scrub through radiographs. The number above the slider indicates the current image index. Scrubbing shows the part’s rotation through the duration of the scan.Projections attributes + radiograph promotion
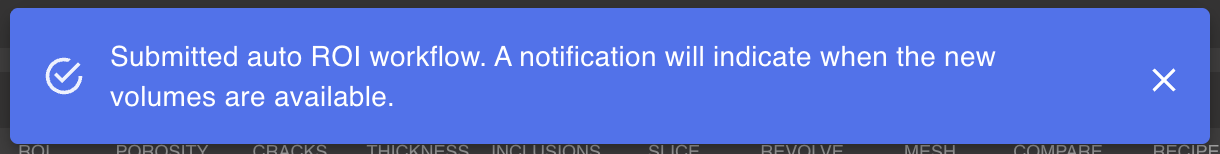
The Attributes Panel, on the right side of the Project Editor, provides a Brightness slider for adjusting radiograph brightness. Toggle “Invert Grayscale” to flip the color map of the Projections images. A single radiograph can be promoted to a high-resolution image for Bookmarking and downloading. While viewing the Projections Data Object, scrub the slider at the bottom of the Viewport to the desired radiograph index. When the desired radiograph is present in the Viewport, select Promote Radiographs. A notification will indicate that a full resolution radiograph has been requested, and the radiograph will load into the Project when processing is complete.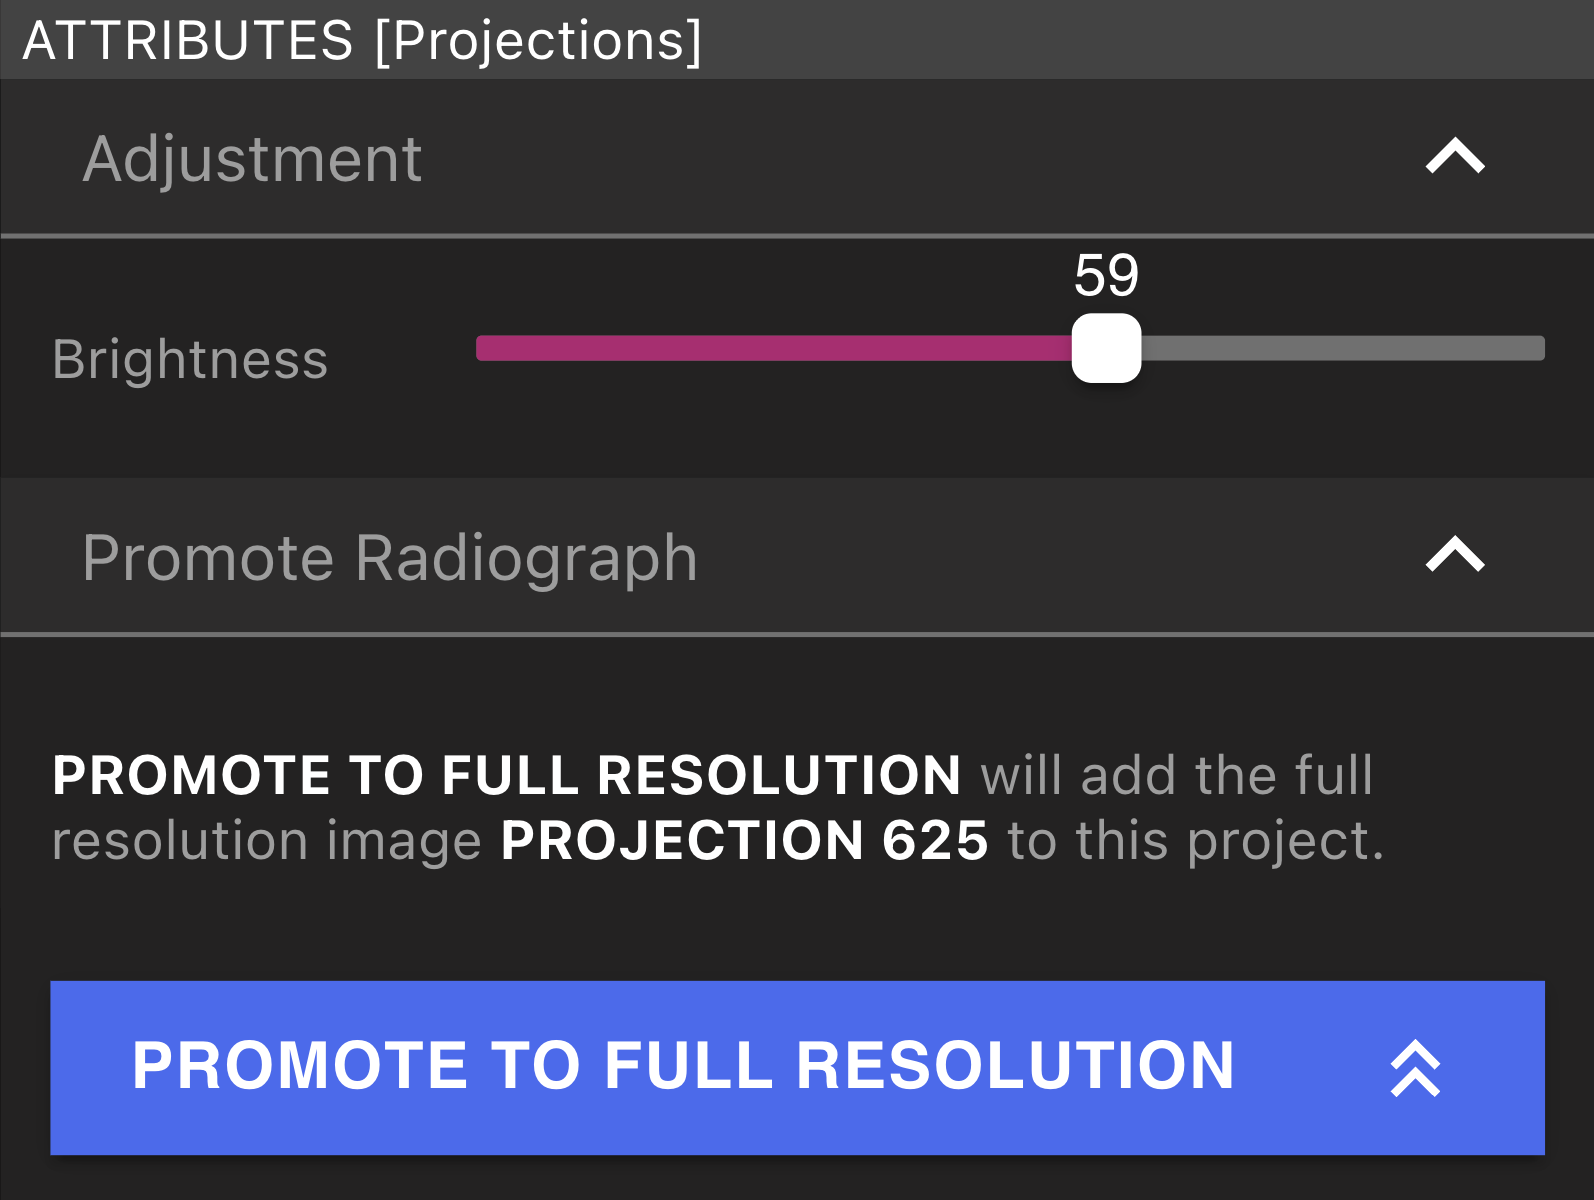
Reconstructions and Regions of Interest (ROI)
Reconstructions and ROIs represent CT (Computed Tomography) data in a Project. A Reconstruction Data Object is automatically created for each Neptune or Triton scan. New Reconstructions can be created via the Reconstruction Workflow in the Correct Tool, and new ROIs can be created via the ROI Workflow in the ROI Tool. ROIs are child Data Objects of a Reconstruction. They provide several advantages, described in the Region of Interest (ROI) article. Because Reconstructions and ROIs share the same underlying data structure, they are described together below.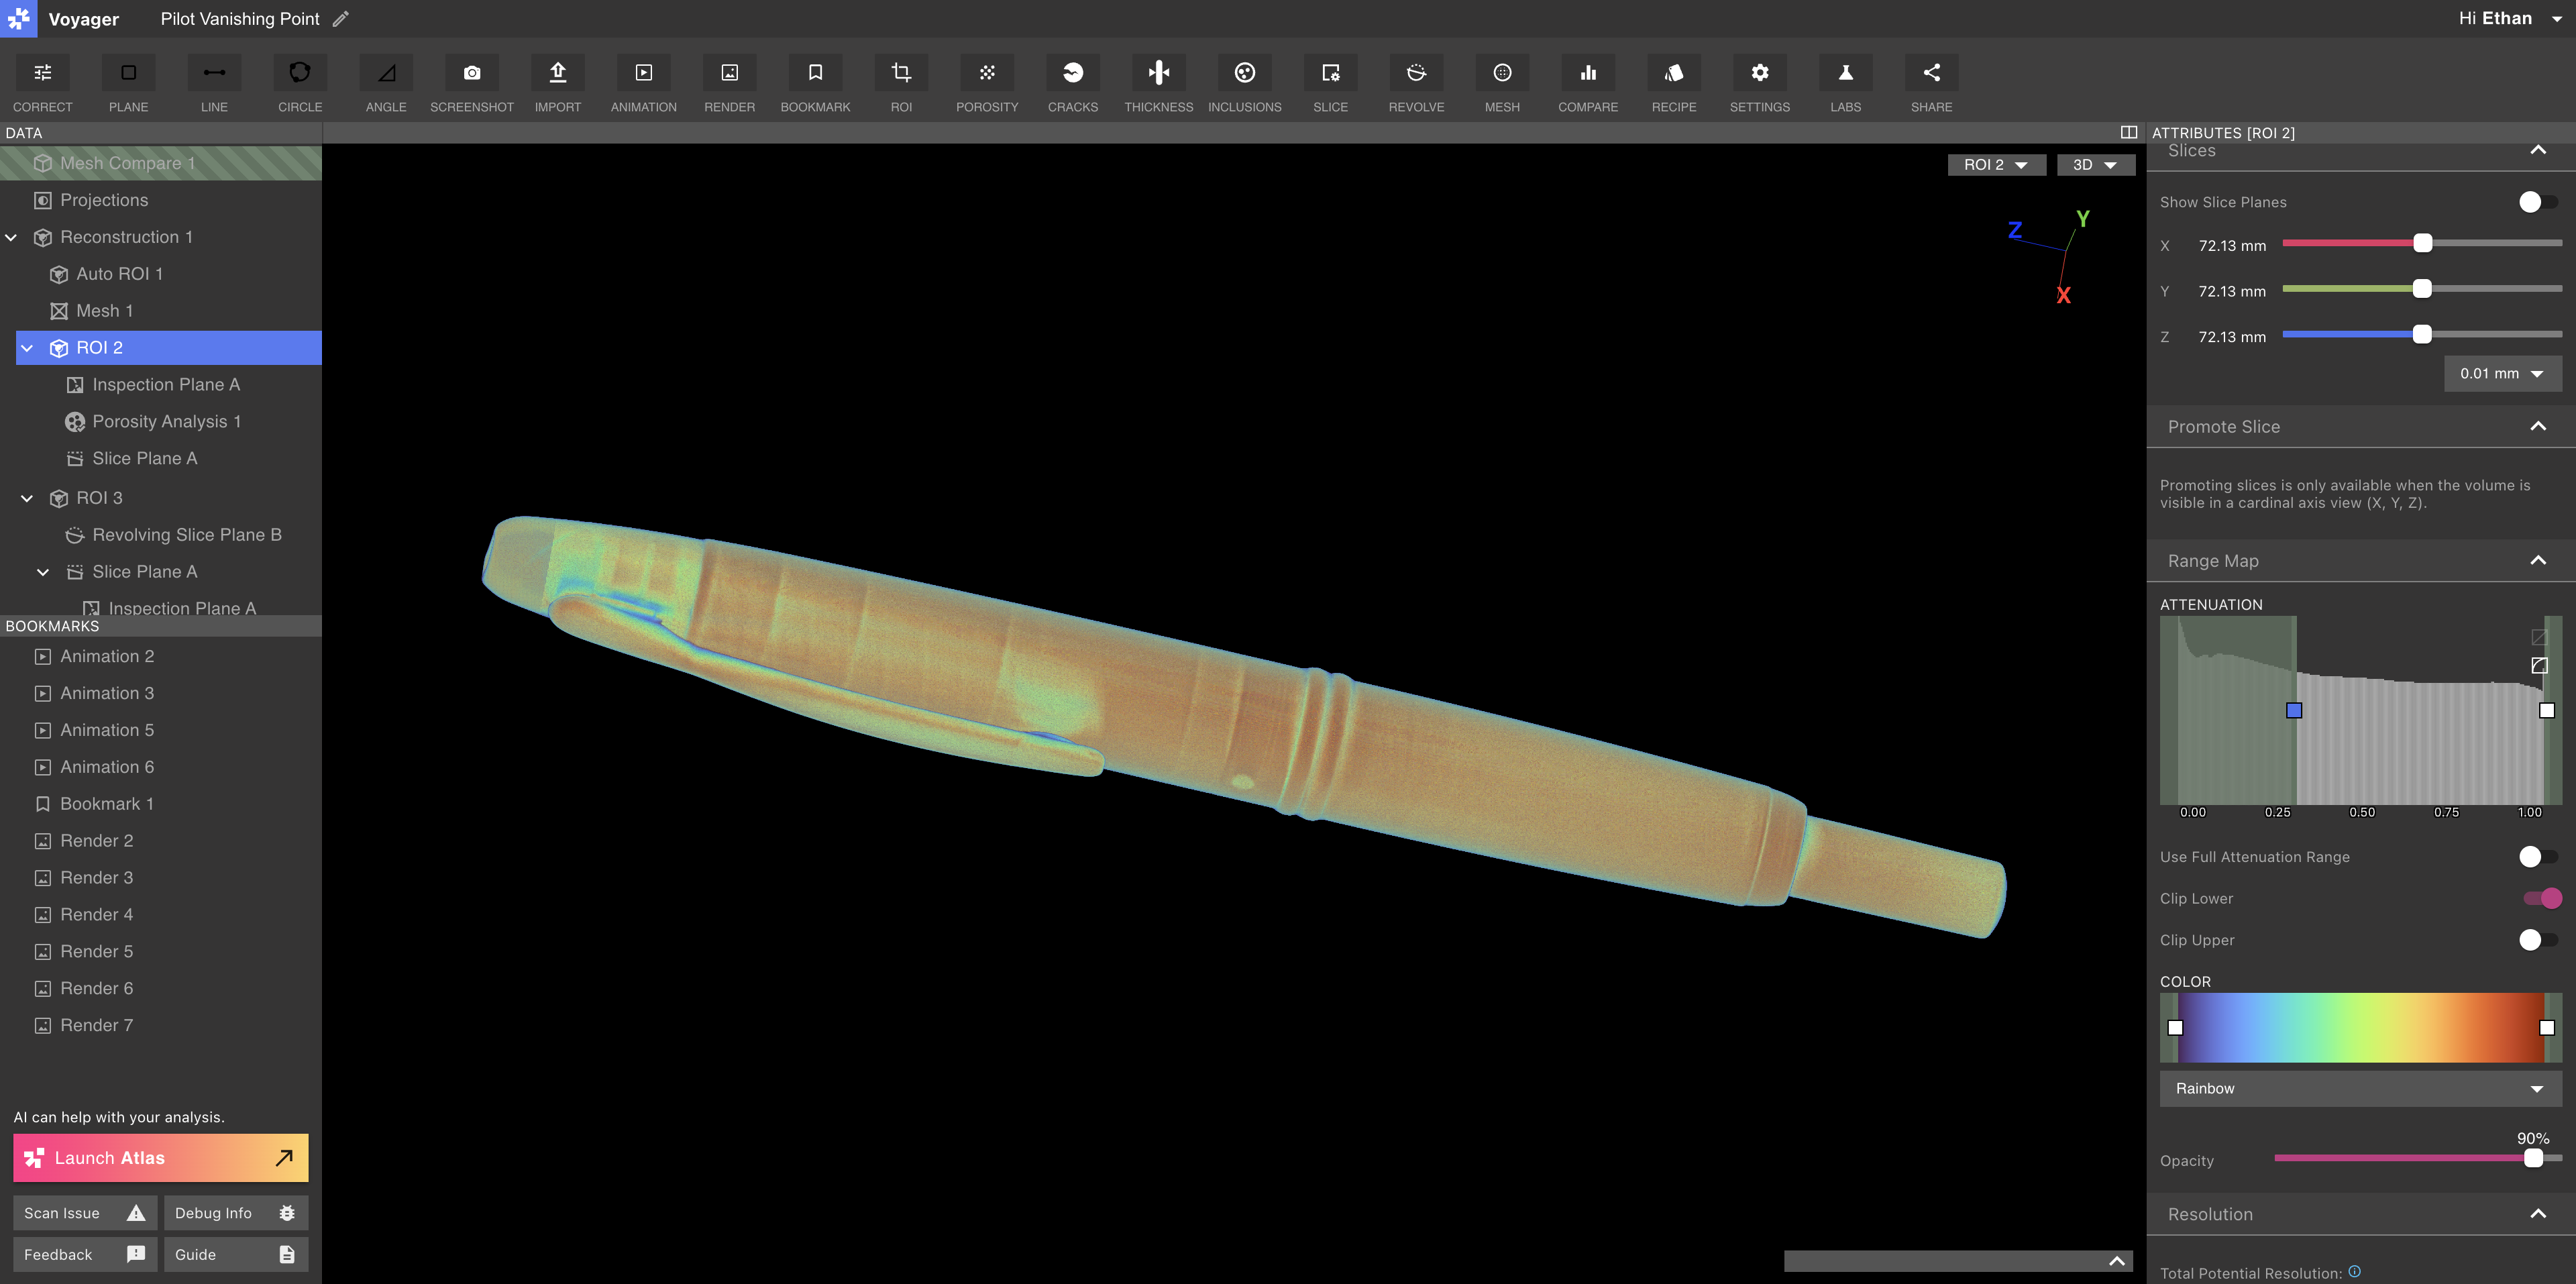
Reconstruction and ROI controls + attributes
When a Reconstruction or ROI is selected, the Attributes Panel displayes the attributes and visualization controls listed in order below.Crop
Use the Crop controls to define a cropped volume of the Reconstruction or ROI. Use the Show Bounds to adjust the crop panels in 2D or 3D views, and use the Enabled toggle to turn cropping on or off.Cropping a Reconstruction or ROI does not renormalize data. Enhanced Visibility, Contrast, and Alignment are only applied when authoring an ROI. For detailed analysis, creating an ROI is recommended.
ROI settings
On a Reconstrution or ROI with child ROIs, the ROI Setting Tab will appear in the Attributes Panel. Use the Display ROI Bounding Boxes toggle to show and hide the bounding boxes of all child ROI volume.Slices
Use the Show Slice Planes toggle to view the X, Y, and Z cardinal slice planes. Move slices along each axis using the three sliders.Promote Slice
Select Promote to Full Resolution on the X, Y, or Z axis to request a high-resolution slice for detailed analysis or Export. This produces a 2D image with maximum resolution availble in the full dataset.Range Map
The Range Map Tab provides controls for visualizing and mapping attenuation data for Reconstructions and ROI Data Objects.Attenuation Graph
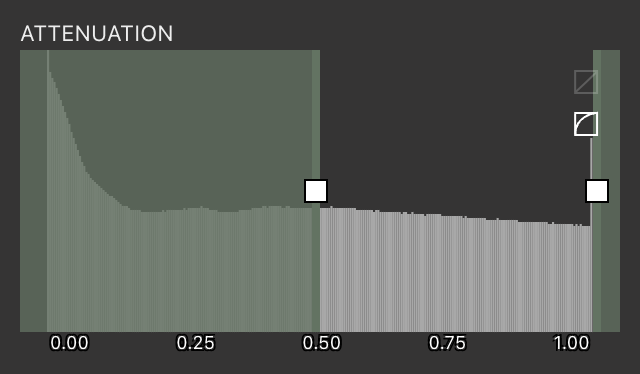
The Attenuation Graph displays the distribution of attenuation values for all voxels in the active Data Object. Attenuation represents the amount of X-ray energy lost per unit distance and is directly correlated with material density.- X-axis: Attenuation values normalized to a range from 0.00 to 1.00.
- Y-axis: Number of voxels at each attenuation value. The y-axis defaults to a logarithmic scale and can be switched to a linear scale using the controls in the upper-right corner of the graph.
Attenuation and color mapping
Voxel coloring in the Viewport is determined by the interaction between the active attenuation range and the active color range.- The active attenuation range is defined using the lower and upper sliders on the Attenuation Graph.
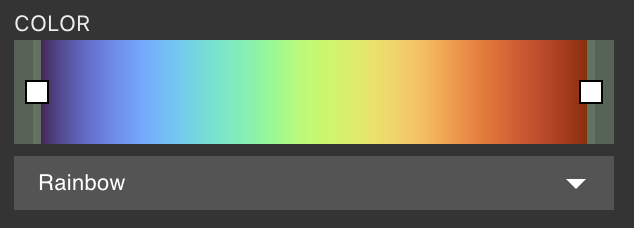
- The active color range is defined using the lower and upper sliders on the Color Graph.
Out-of-range attenuation behavior
Voxels with attenuation values outside the active attenuation range are handled using one of two behaviors, controlled independently for the lower and upper bounds.Clipping + clamping
When a Clip toggle is enabled for the lower or upper bound, voxels with attenuation values beyond that threshold are made fully transparent and are not visible in the Viewport. When a Clip toggle is disabled for the lower or upper bound, voxels with attenuation values beyond that threshold are clamped to the corresponding bound of the active attenuation range. These voxels are shaded using the color at the matching bound of the active color range and remain visible in the Viewport. By default, the lower bound of the active attenuation range is clipped to reduce the influence of low-density voxels, while the upper bound is clamped.Color range
Seven preset color ranges are available:- Rainbow
- Stepped Rainbow
- Plasma
- Viridis
- Cold to Hot
- Monoblue
- Grayscale
Use Full Attenuation Range
The Use Full Attenuation Range toggle changes how attenuation values are mapped to colors.- When disabled (default), only the active attenuation range (defined by the attenuation sliders) is mapped to the active color range.
- When enabled, the full attenuation range from 0.00 to 1.00 is mapped to the active color range, regardless of the attenuation slider positions.
Opacity
The Opacity slider adjusts the global opacity of all voxels in the active Data Object.Invert Color Map
Flip the color map, swapping the colors of low- and high-attenuating regions.Resolution
The Resolution Tab displays data resolution properties for the current Reconstruction or ROI. Total Potential Resolution represents the full-resolution voxel size attainable from the current (or parent, if an ROI is selected) Reconstruction Data Object by creating smaller ROIs. These values depend on scan parameters; for example, increasing total scan duration reduces achievable resolution. Resolution of ROI represents the resolution and voxel size specific to the currently-selected Reconstruction or ROI.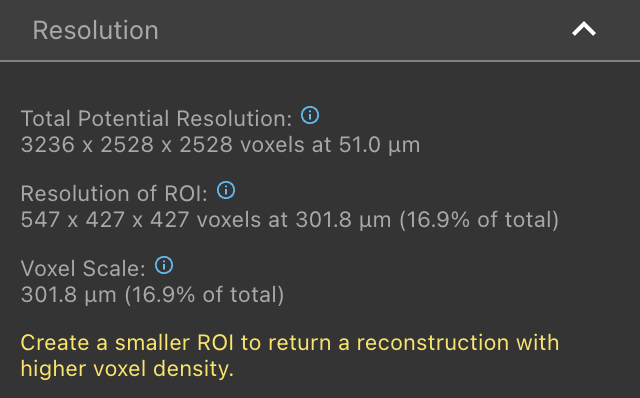
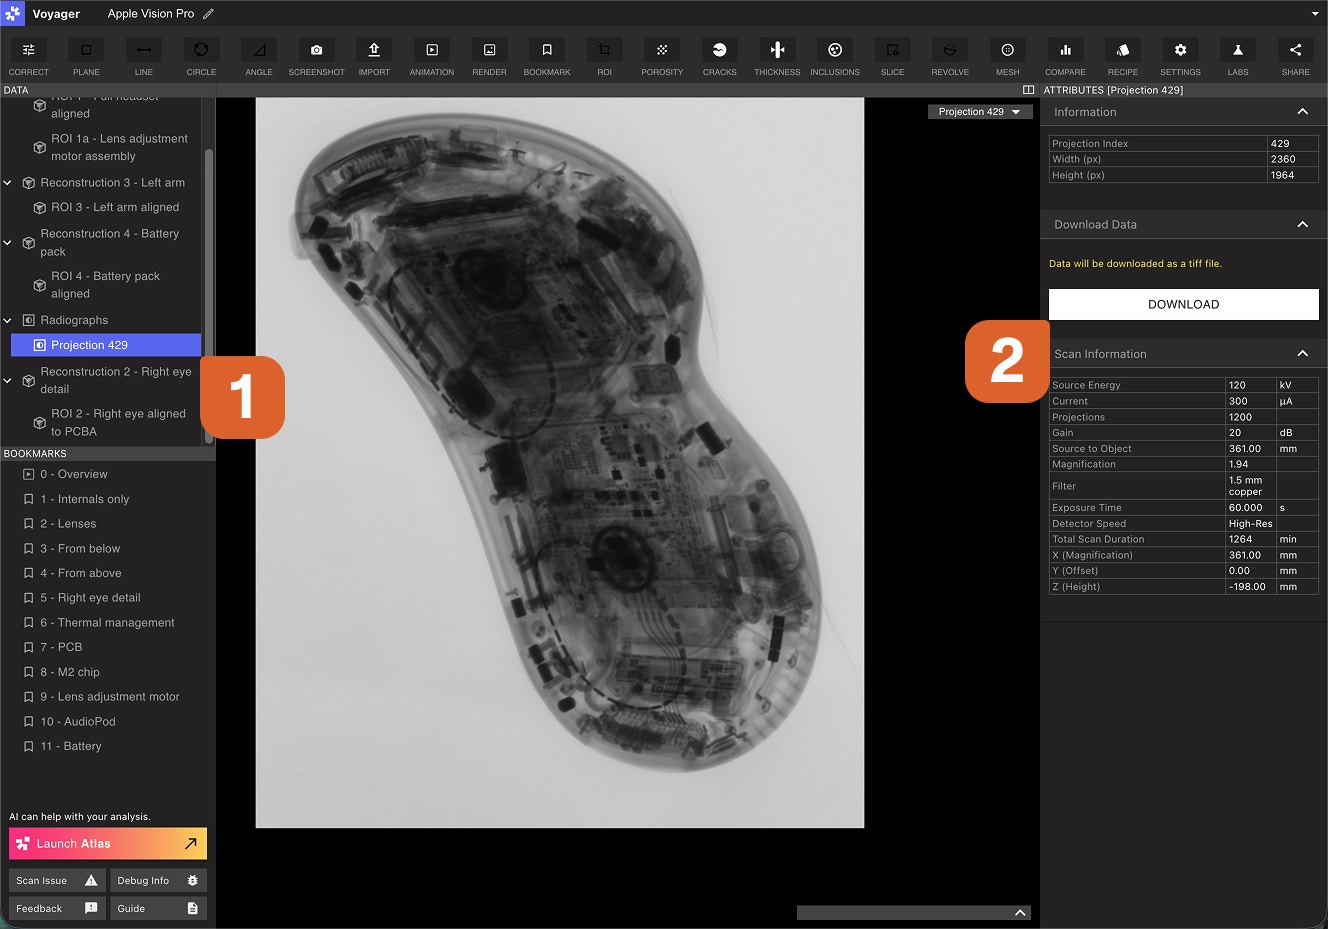
Scan information
The Scan Information Tab lists all scan settings associated with the Project. These settings are constant across all Reconstructions and ROIs within the Project.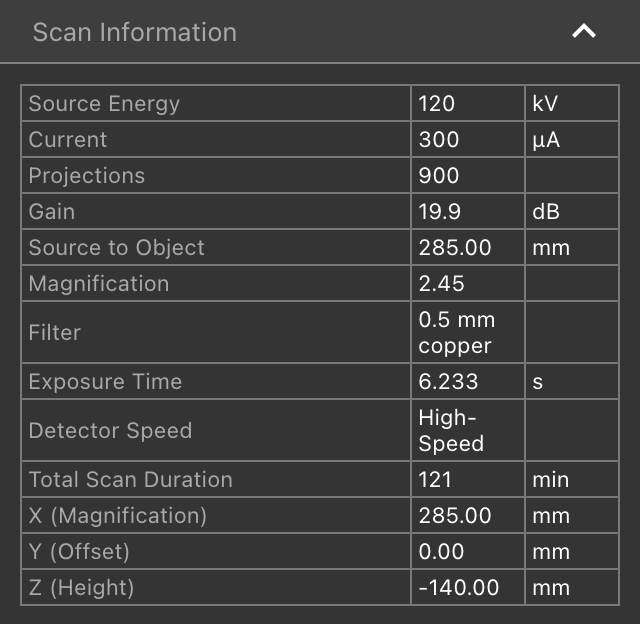
Download volume data
Select Download to save a.NRRD file containing voxel-level data for the current Data Object.
Planes
Voyager supports three types of planes: Slice Planes, Revolving Slice Planes, and Inspection Planes.Slice Planes
A Slice Plane represents a custom slice of a Reconstruction or ROI. Slice Planes are useful for examining orientations not aligned with the X, Y, or Z cardinal axes. They appear in the Viewport’s Data Object dropdown. Use the Slice Depth slider in the Adjustment Tab or the slider below the Viewport to scrub along the Slice Plane axis. See the Slice Tool article for instructions on creating Slice Planes.Revolving Slice Planes
A Revolving Slice Plane creates a radial slicing axis, useful for inspecting circular or cylindrical parts. Use the Slice Angle slider or the slider below the Viewport to rotate around the Revolving Slice Plane axis. See the Revolve Tool article for instructions on creating Revolving Slice Planes.Inspection Planes
An Inspection Plane is a fixed 2D slice from a Reconstruction or ROI. Measurement Tools (Line, Circle, Angle) are available only on Inspection Planes. The Source attribute in the Plane Settings Tab indicates the Cardinal or Slice Plane used to generate the Inspection Plane, as well as the Plane’s fixed position.Meshes
A Mesh Data Object can be created via the Mesh Workflow in the Mesh Tool, or uploaded via the Import Tool.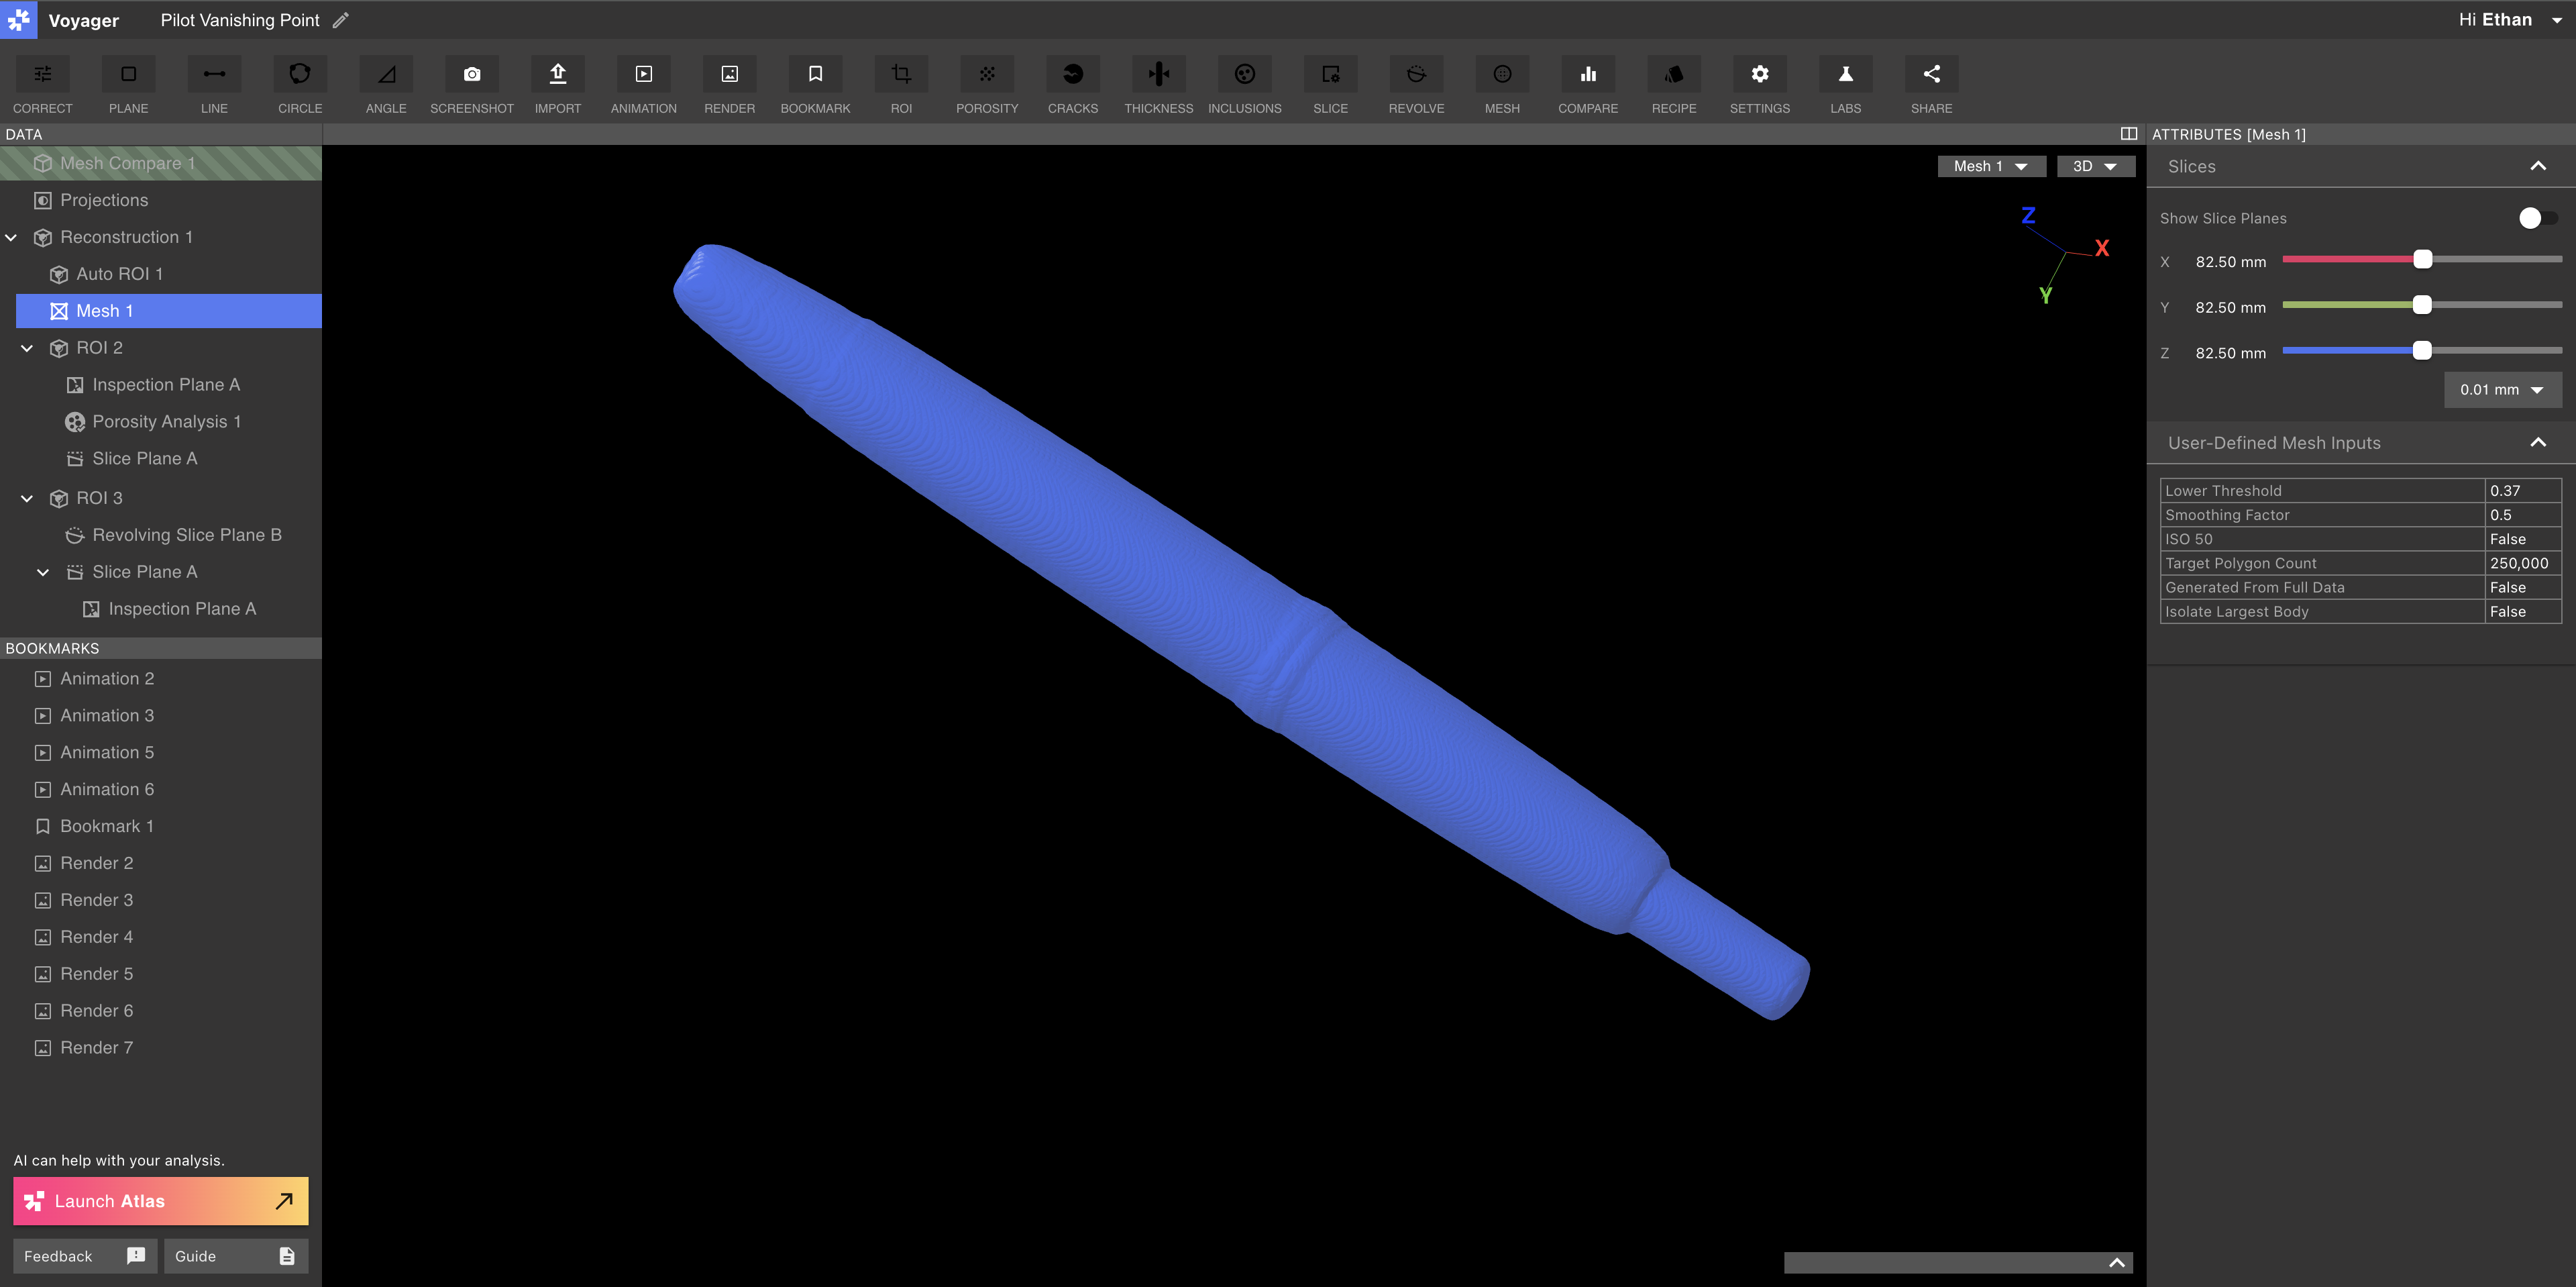
.STL file of the Mesh.
Analysis Results
The Porosity, Cracks, Thickness, and Inclusions Tools each generate a new Analysis Results Data Object by running an Analysis Workflow. Each Analysis Results object type provides specific attributes and visualization settings in the Attributes Panel.Analysis Results attributes
The Attributes Panel of an Analysis Results Data Object contains controls and attributes of the analysis. In the example below for a Porosity Analysis Results Data Object, the Porosity Metrics Tab displays metrics for the selected pore as well as for all computed pores.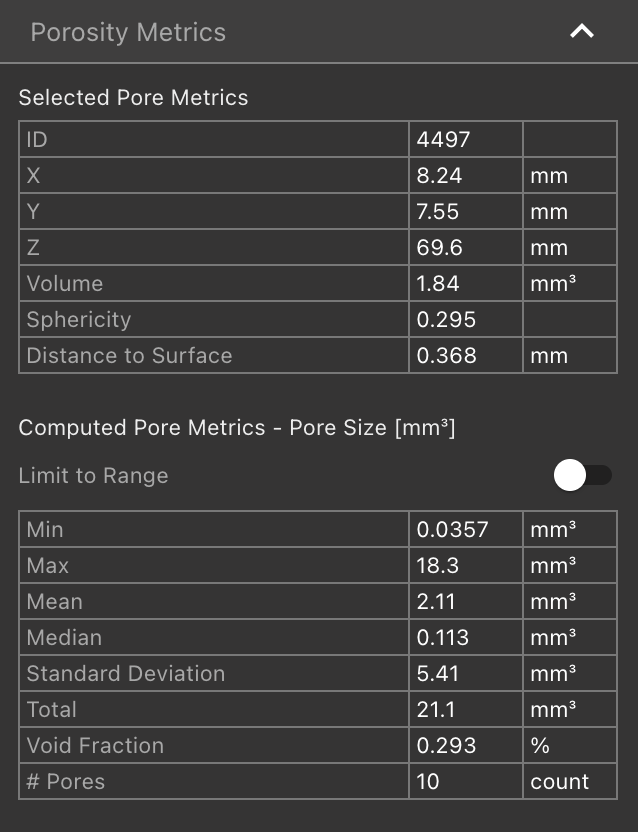
Workflows
Workflows in Voyager are data-processing tasks submitted to the Voyager Cloud. Tools that require significant computation use Workflows so that users can continue analysis while data processing occurs in the background. Worfklows in Voyager include:- Reconstruction Worfklow
- ROI Workflow
- Porosity Workflow
- Cracks Worfklow
- Wall Thickness Workflow
- Inclusions Workflow
- Mesh Workflow
- Mesh Compare Workflow