Overview
Identifying defects in prototypes, manufacturing processes, and lifecycle analyses is critical to product development. Voyager can help you find and analyze crack, leak, and surface defects accurately and quickly to get better products to market faster and in a more cost-effective manner.
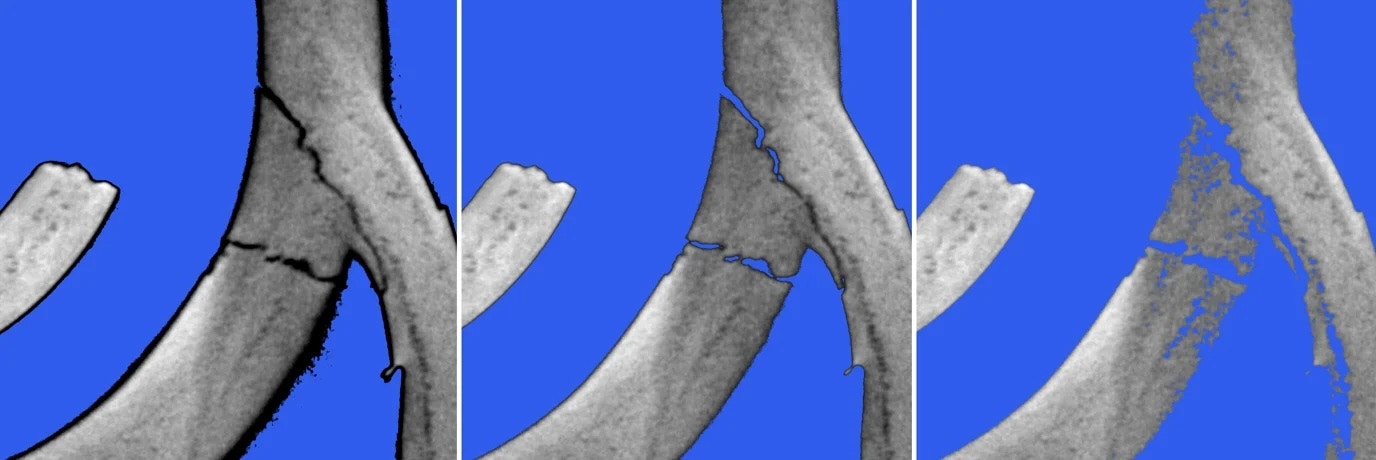
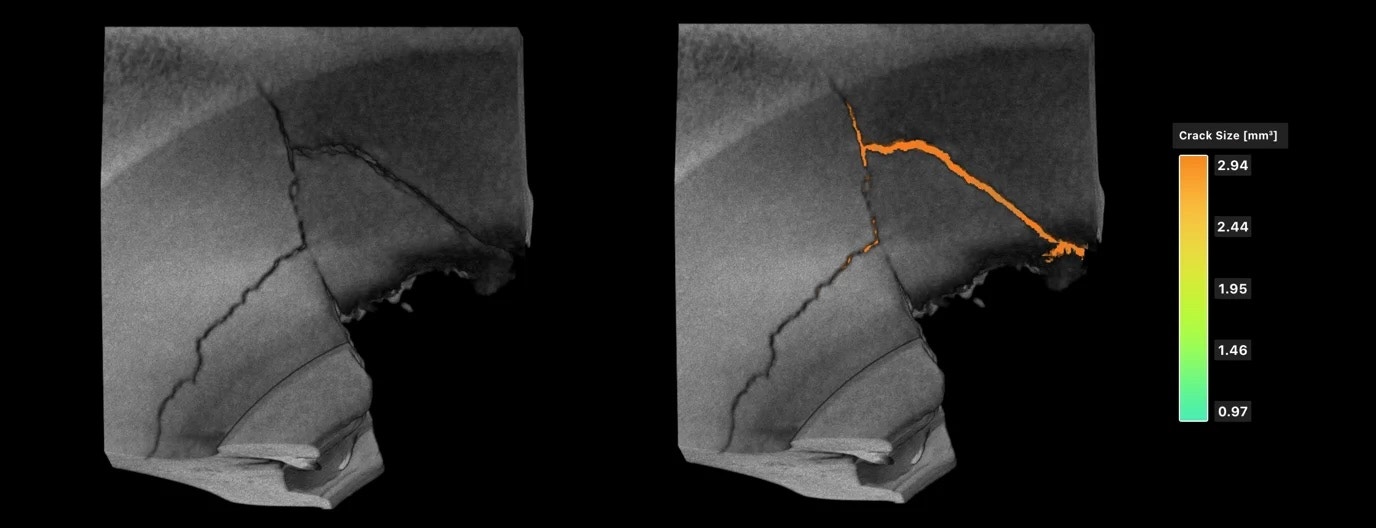 Cracks refer to fractures, fissures, or discontinuities within a material, often resulting from structural failures, impact damage, or lifecycle wear and tear.
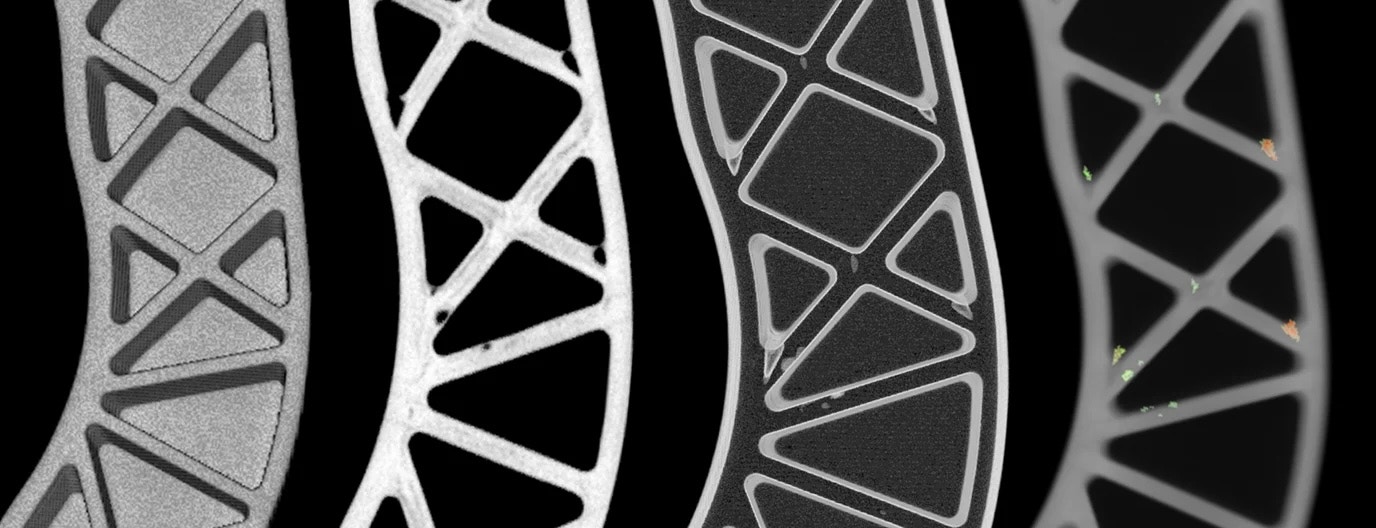 Surface voids and pitting manifest as small, localized depressions or cavities on the surface of a material. These voids typically result from various forms of deterioration, corrosion, mechanical damage, or manufacturing process issues.
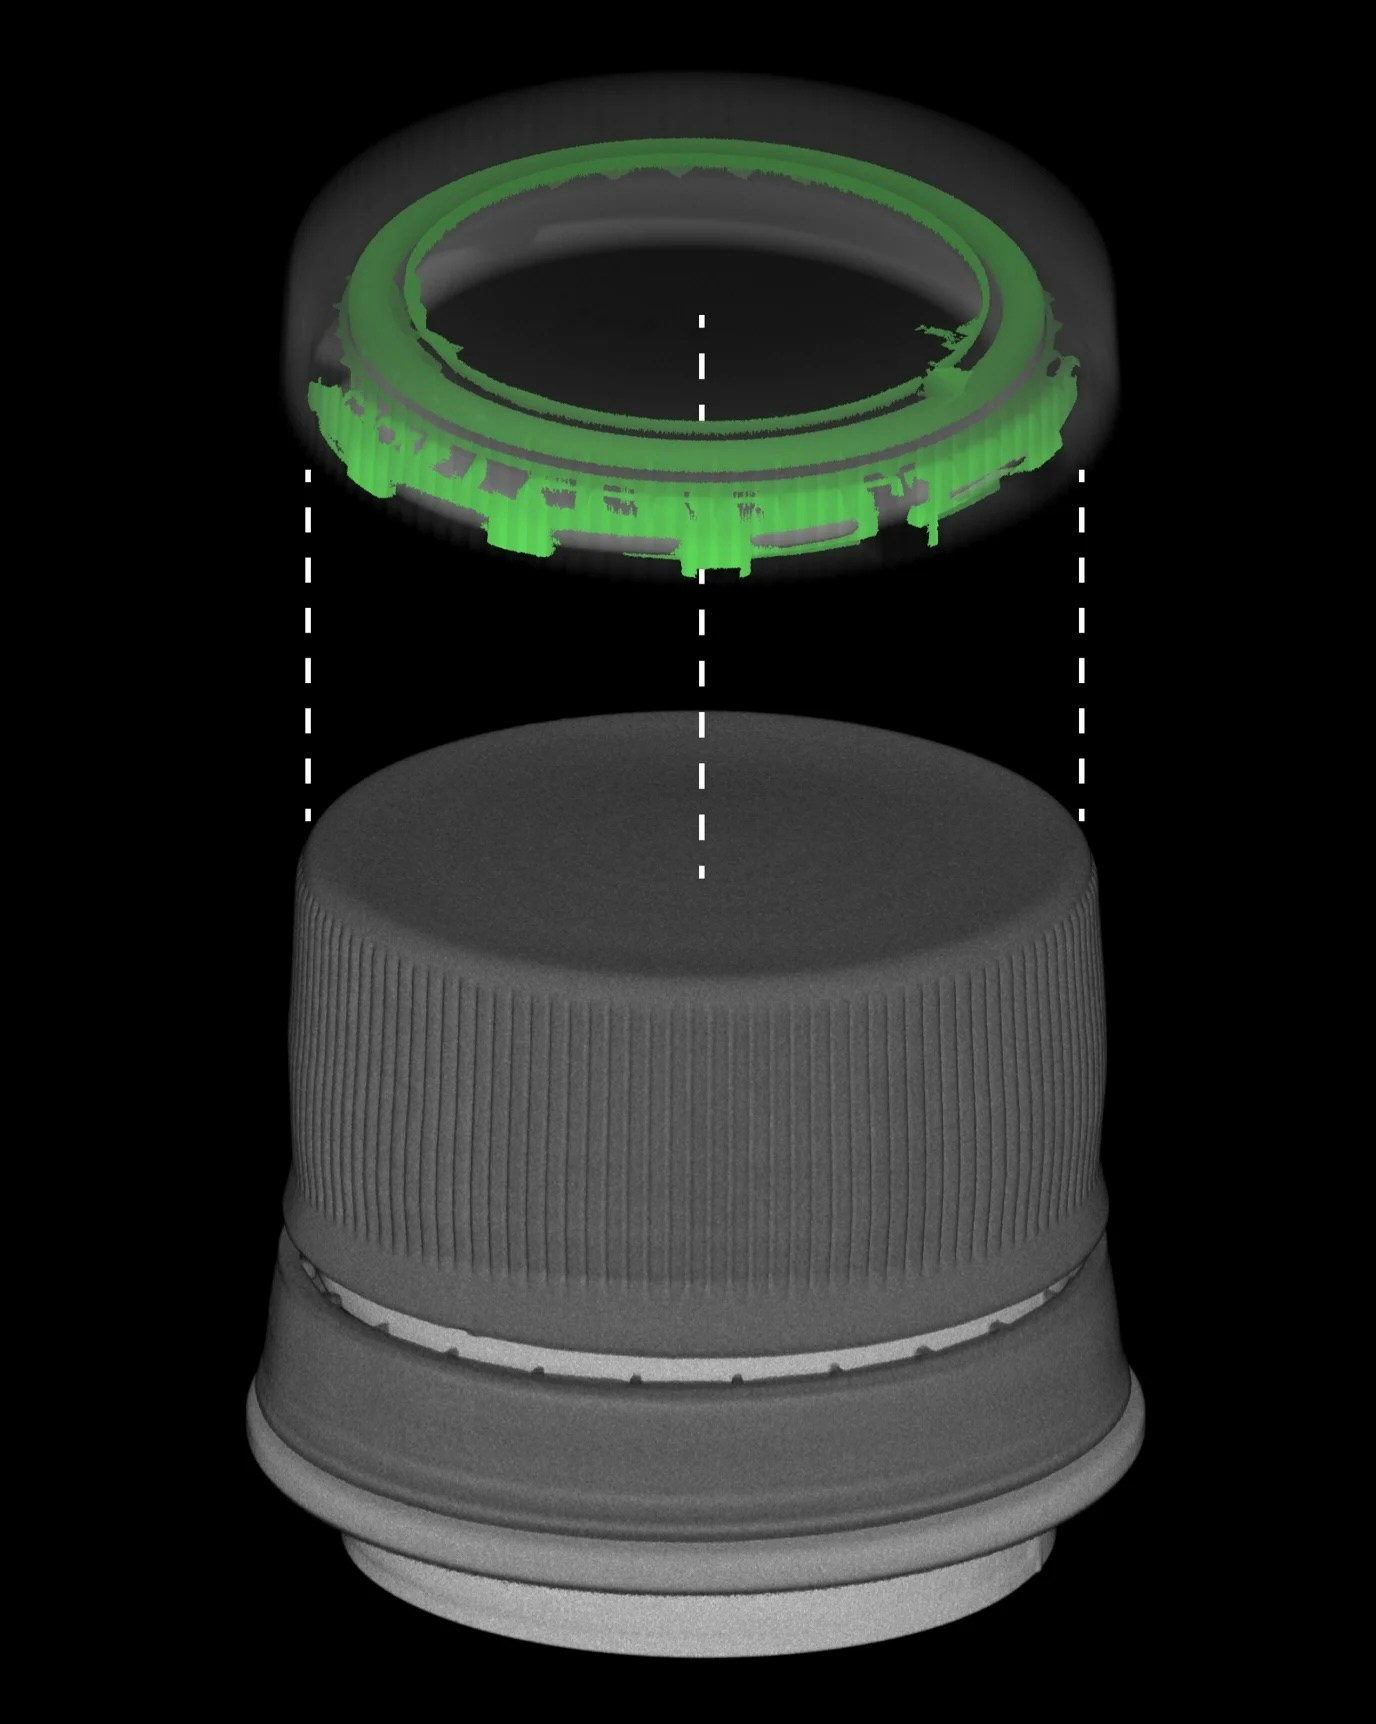 Leaks refer to unintended pathways through which a substance, such as a fluid or gas, escapes from a sealed or contained system that has been improperly designed, manufactured, damaged, or worn.
Cracks, surface voids, and leaks arise in various forms and sizes, ranging from visible macroscopic fissures to microscopic hairline fractures and surface deformations not visible to the naked eye. These defects can compromise a part or assembly’s structural integrity, performance, functionality, appearance, or structural integrity – which may lead to reliability and safety issues.
Leaks refer to unintended pathways through which a substance, such as a fluid or gas, escapes from a sealed or contained system that has been improperly designed, manufactured, damaged, or worn.
Cracks, surface voids, and leaks arise in various forms and sizes, ranging from visible macroscopic fissures to microscopic hairline fractures and surface deformations not visible to the naked eye. These defects can compromise a part or assembly’s structural integrity, performance, functionality, appearance, or structural integrity – which may lead to reliability and safety issues.
Authoring Crack Detection
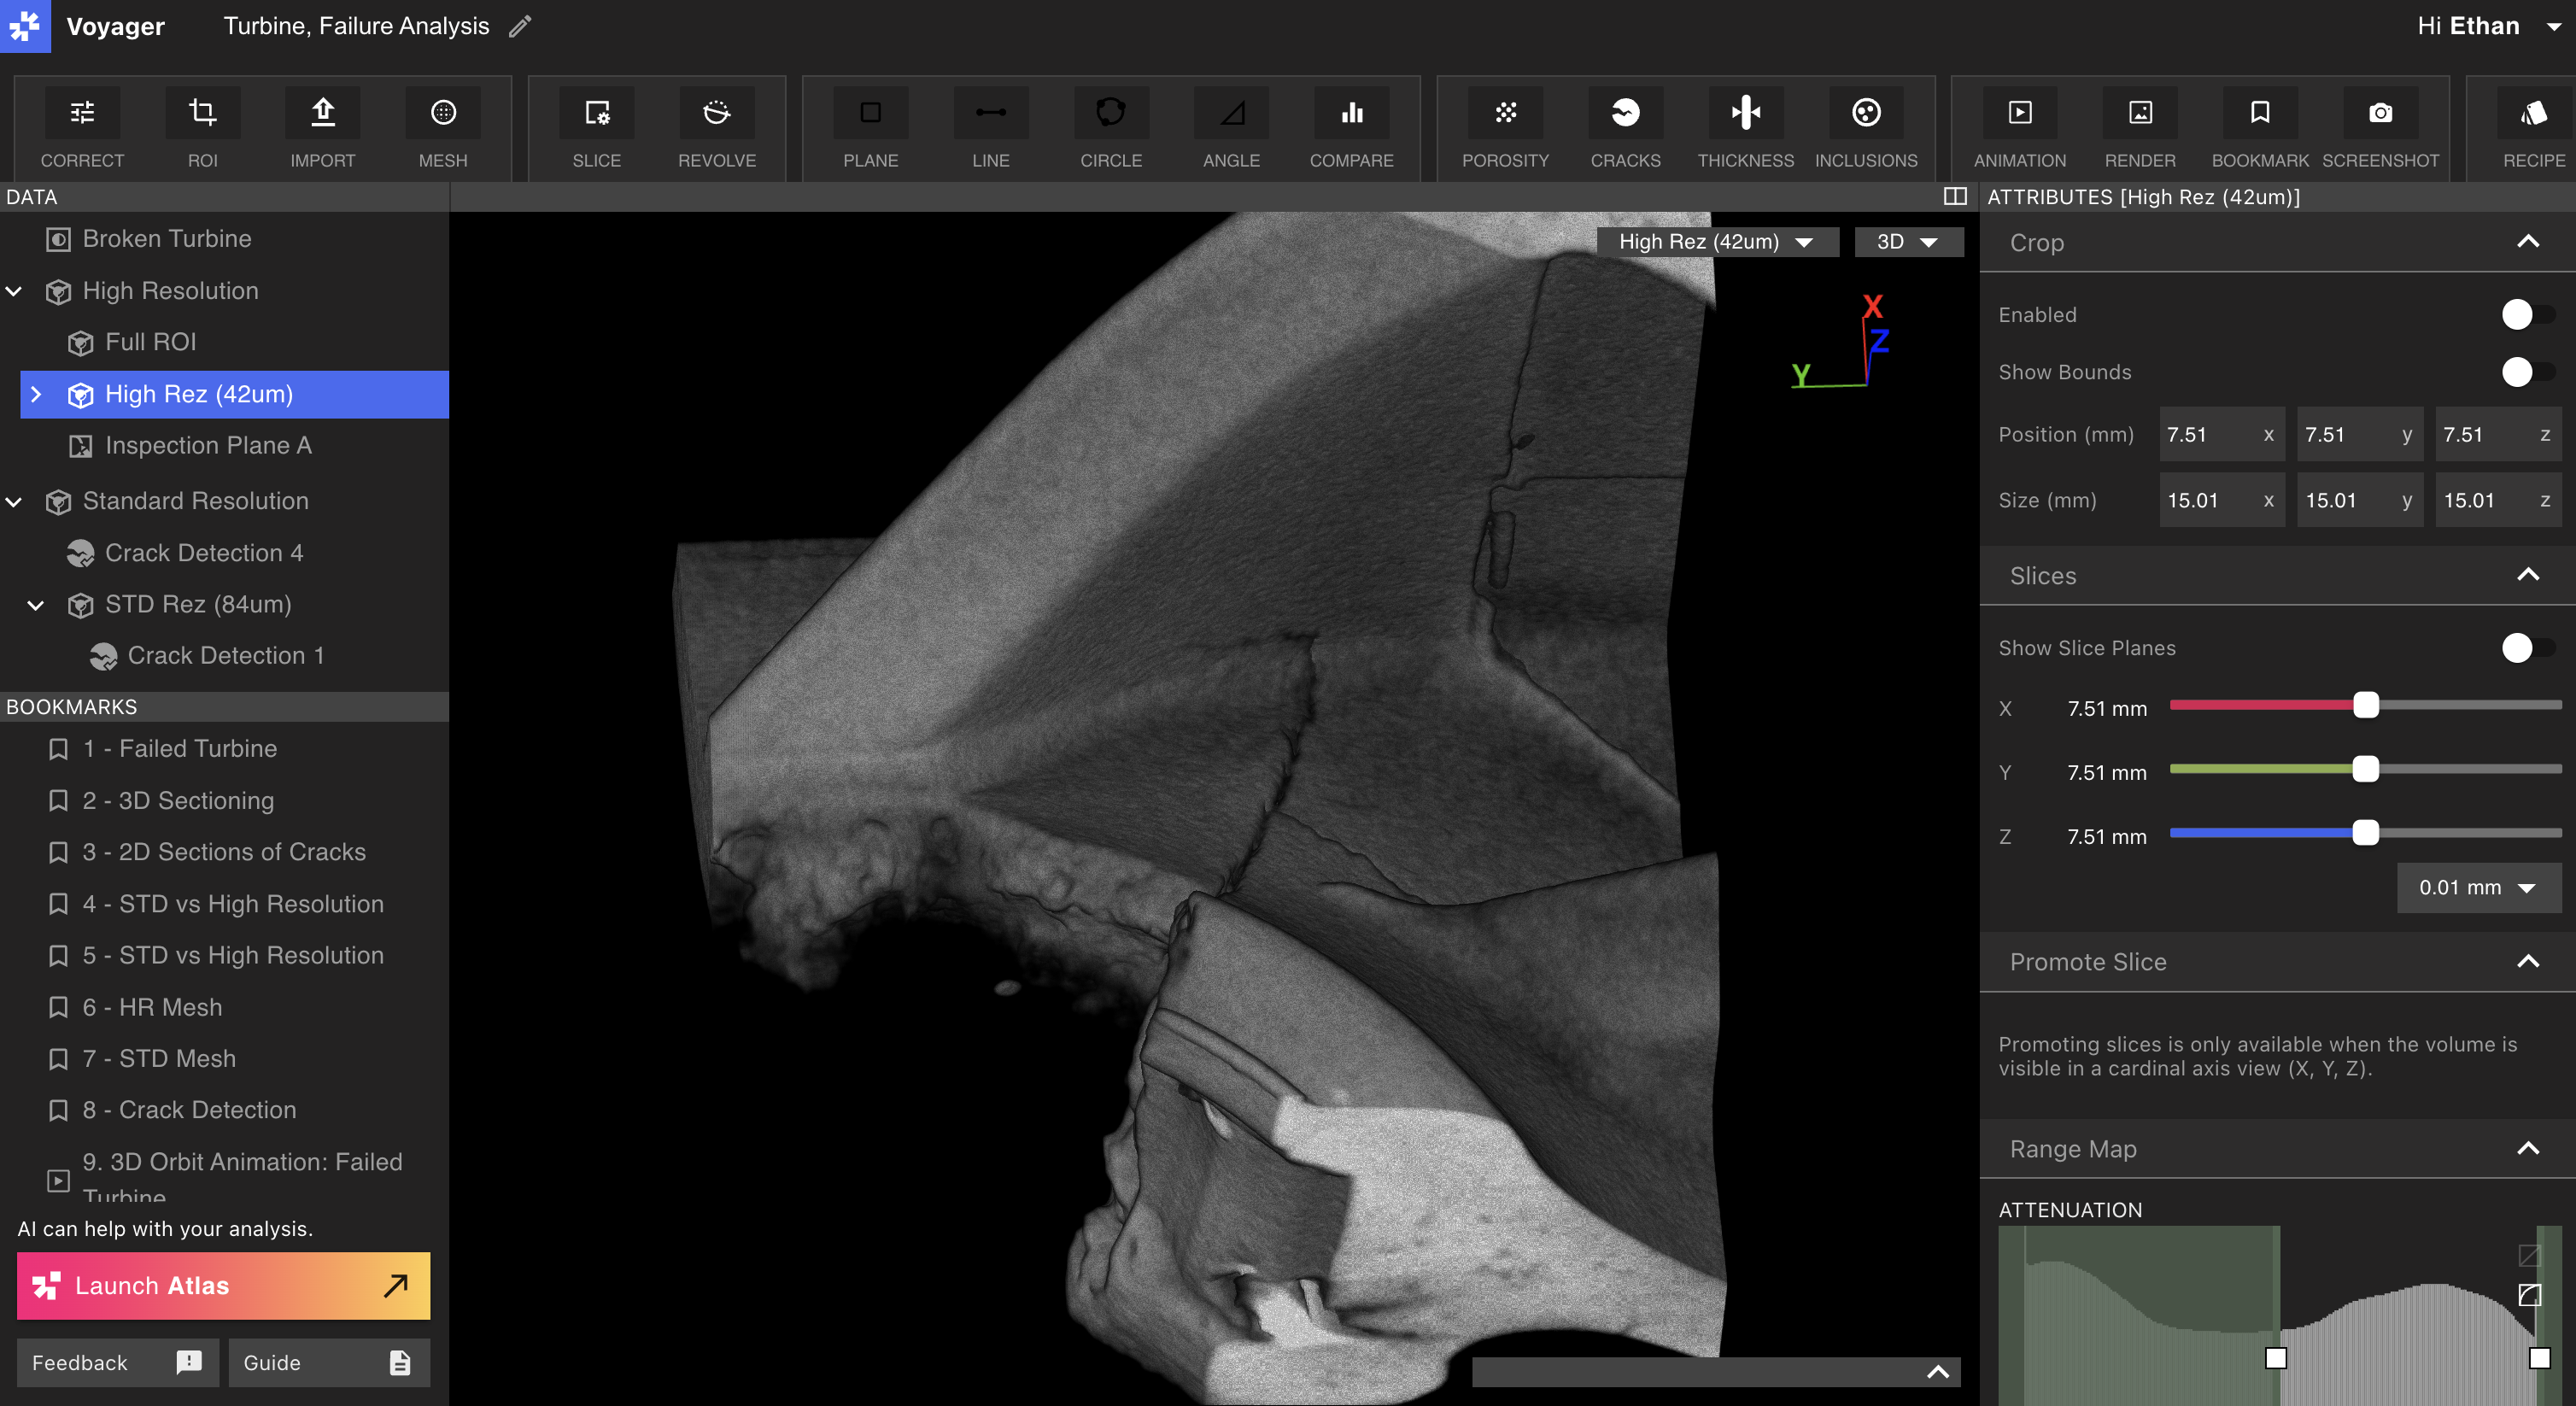
To begin, select a Reconstruction or ROI from the Data Panel, and choose the Cracks Tool from the Toolbar.
 Select the desired settings within the Crack Detection Workflow Editor on the right Panel:
 Establish Crack Threshold: Specifies the maximum attenuation of a region that can be considered a crack. To produce a Crack Detection Analysis with a more sensitive crack detection (more / larger cracks), increase the Crack Threshold; to produce a Crack Detection Analysis with less sensitive crack detection (fewer / smaller cracks), decrease the Crack Threshold.
The appropriate threshold for your analysis will depend on a variety of factors including (but not limited to) scan settings, ROI configuration, and crack geometry. Narrower cracks are more effectively highlighted with a higher threshold, whereas wider cracks can typically be identified with a lower threshold.
 Max Crack Diameter: Regions with a diameter greater than this value will be considered to be area outside of the part, rather than a crack within the part. These regions will not show up in the Crack Detection Analysis data object.
Minimum Pore Size: Only crack with a volume above this value will be produced in the Crack Detection Analysis. Increasing the minimum pore size may decrease the number of cracks produced by the Crack Detection Analysis Workflow.
Select “Submit” to run the analysis - you will receive a notification within the Project once the analysis has been completed so that you can view the results.
Max Crack Diameter: Regions with a diameter greater than this value will be considered to be area outside of the part, rather than a crack within the part. These regions will not show up in the Crack Detection Analysis data object.
Minimum Pore Size: Only crack with a volume above this value will be produced in the Crack Detection Analysis. Increasing the minimum pore size may decrease the number of cracks produced by the Crack Detection Analysis Workflow.
Select “Submit” to run the analysis - you will receive a notification within the Project once the analysis has been completed so that you can view the results.
Analyzing Crack Detection
Select a Crack Detection Analysis Data Object from the Data Panel to begin analyzing Cracks.
Computed Crack Metrics: Metrics on all cracks produced by the Crack Detection Analysis display within the Attributes Panel. Limit these metrics to cracks that match the currently-selected property filter (see below) using the Limit to Range toggle.
 Data filtering and customization: Customize the data that is shown in the Viewport from the Attributes Panel. Use the Data Map Tab to choose a metric by which cracks are displayed: either Crack Size or Sphericity.
Cracks with high and low values of the currently-selected property can be filtered out of view using the Crack Detection Graph. Define thresholds of the current property by moving the upper and lower sliders of the Crack Detection Graph, and only cracks falling between the specified range will remain present in the Viewport.
Data filtering and customization: Customize the data that is shown in the Viewport from the Attributes Panel. Use the Data Map Tab to choose a metric by which cracks are displayed: either Crack Size or Sphericity.
Cracks with high and low values of the currently-selected property can be filtered out of view using the Crack Detection Graph. Define thresholds of the current property by moving the upper and lower sliders of the Crack Detection Graph, and only cracks falling between the specified range will remain present in the Viewport.
 Single-crack selection: Select a crack in the Viewport to open its individual metrics in the Attributes Panel, including position, volume, and sphericity. A crack can also be selected by searching its ID, which displays when a crack is selected. Select crack by ID to locate specific defects and relate them directly to downloadable analysis reports.
If you are experiencing Viewport performance issues when visualizing a high number of cracks, surface voids, or leaks, consider reducing the Viewport resolution (in the “Settings” button) or the Data Map range.