The ROI Tool creates a Region of Interest (ROI), a Data Object that defines a volumetric subsection of a Reconstruction or other ROI. ROIs are a fundamental tool in Voyager - visualizing and performing analyses on ROIs, rather than a Reconstruction of the full scan volume, has several benefits described below.
Benefits of ROIs
Renormalization
Renormalization, an automatic step of the ROI Workflow, adjusts intensity mapping of attenuation values based on the data in the Region of Interest. View data in as high resolution as possible by creating ROIs. Read more in the Renormalization article.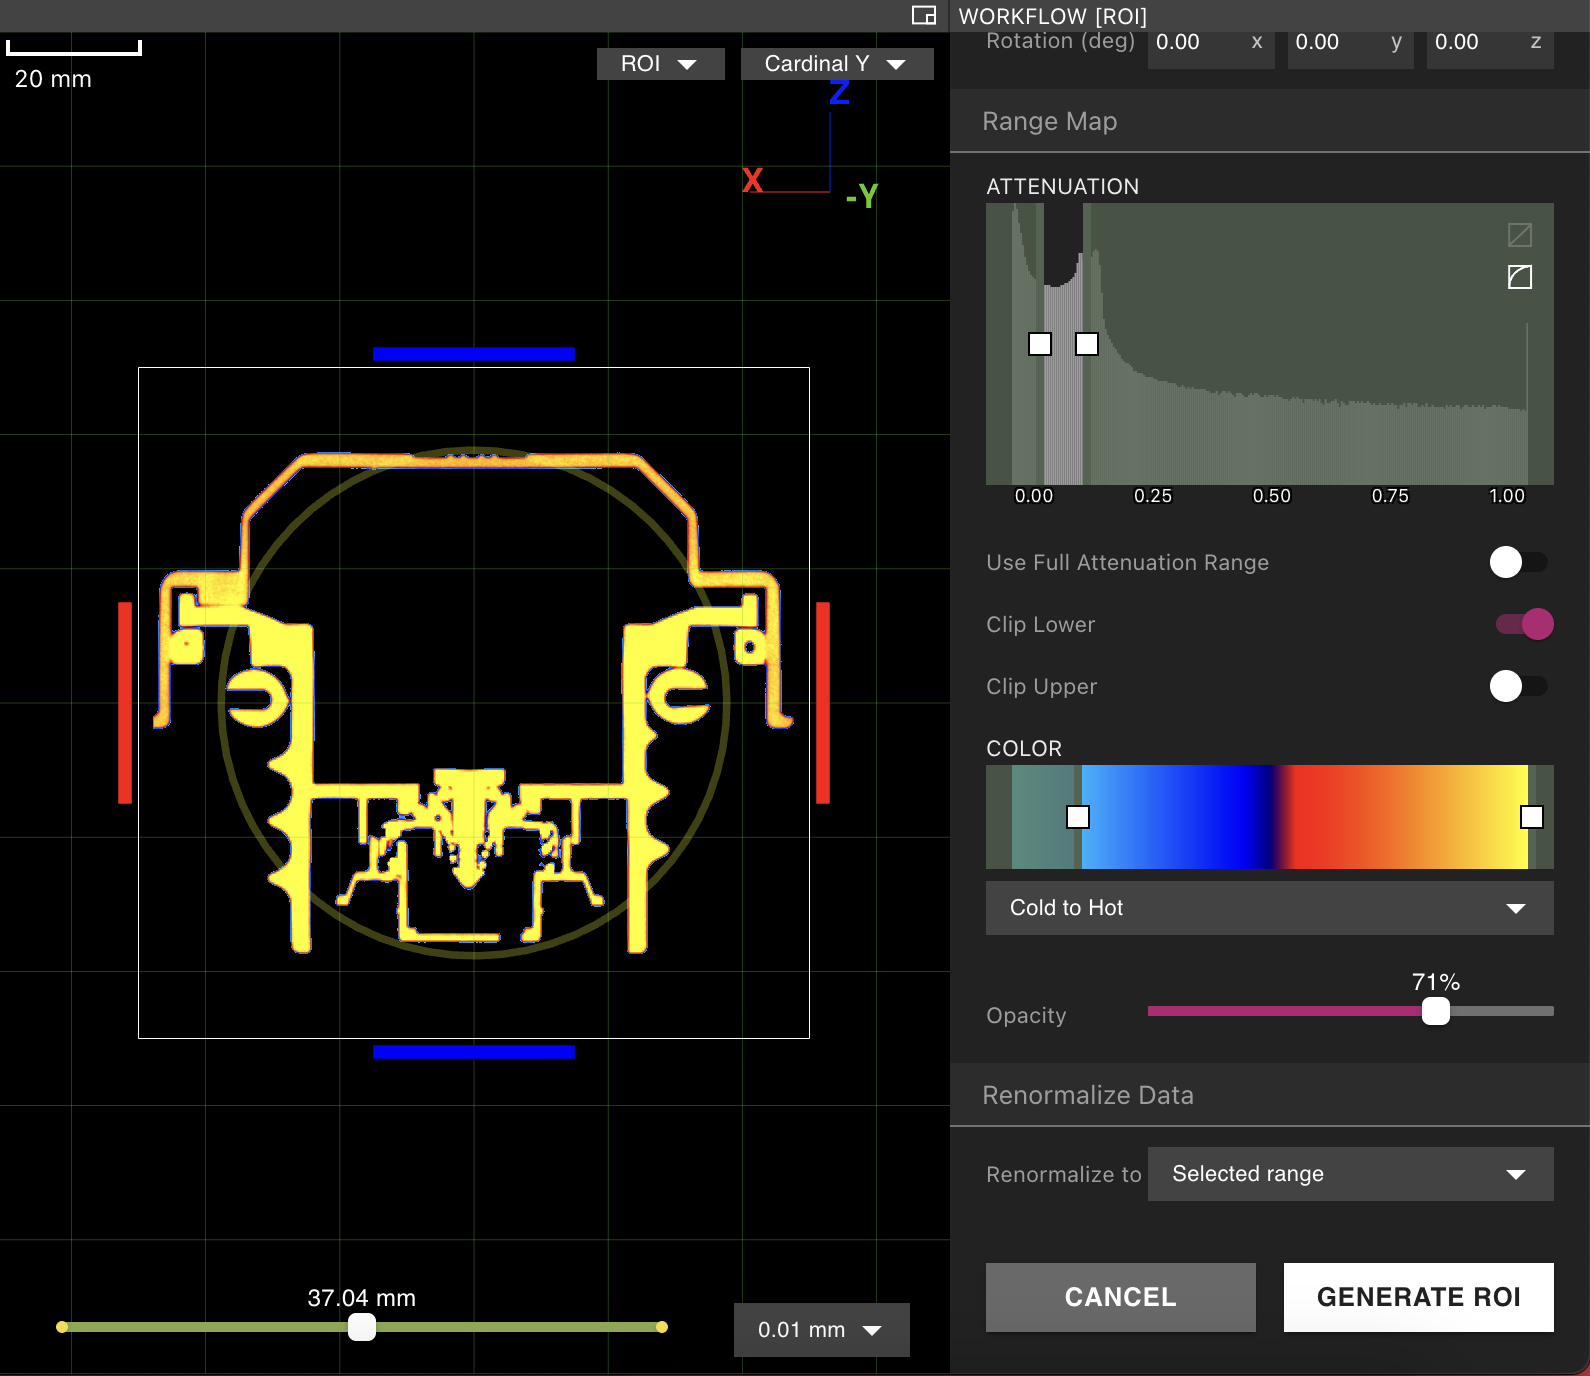
Alignment
Orient the part to the preferred axes with the ROI orientation handles. This makes scrubbing through the Cardinal X, Y and Z planes useful, and helps standardize measurements and comparisons across Projects. See the Inspection Planes article for taking measurements once aligned.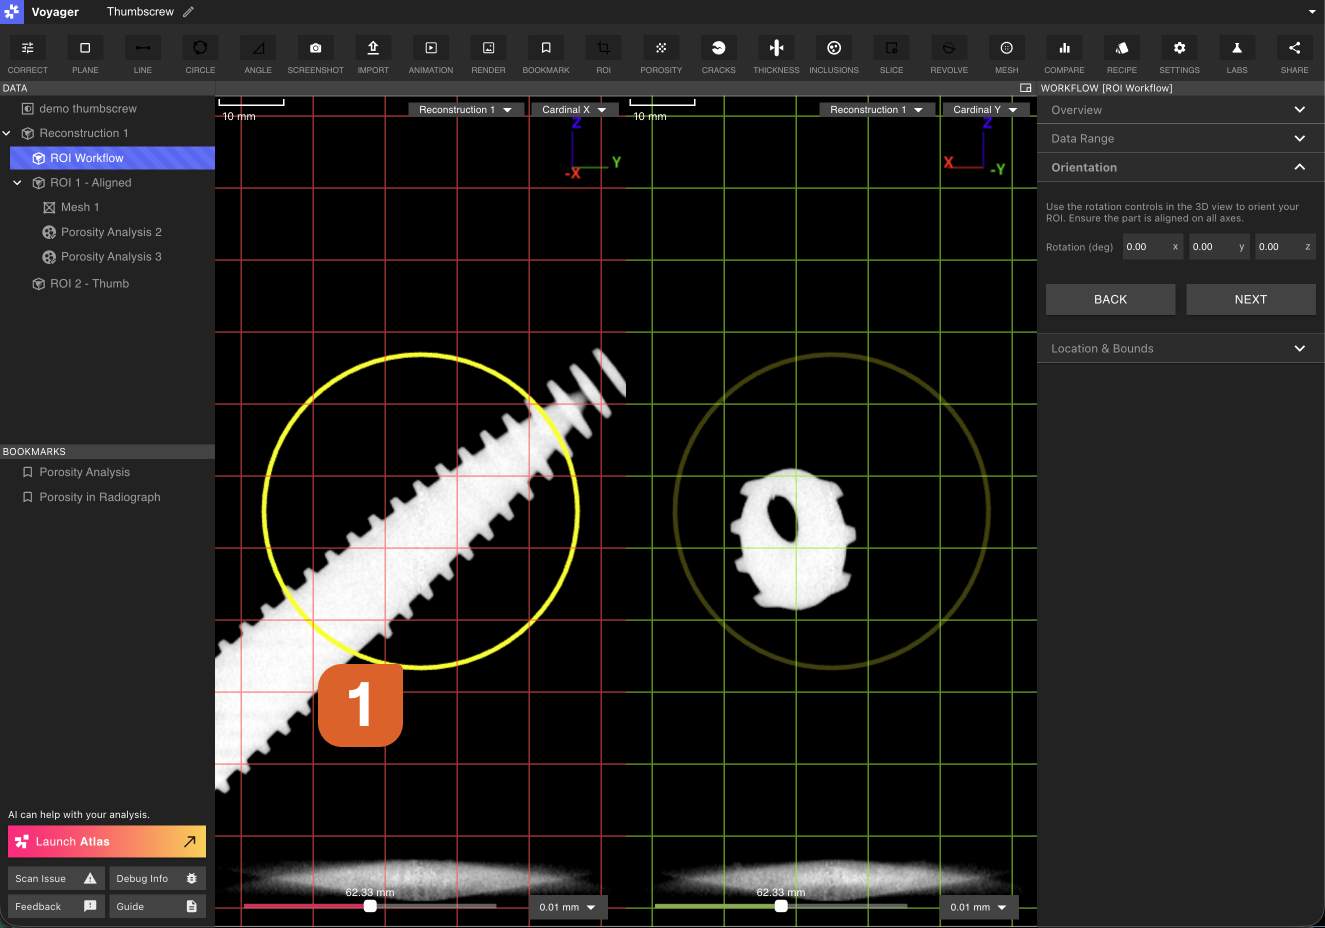
Enhanced contrast
Exclude materials outside an area of interest to improve contrast on relevant features. This can make visual inspection and downstream analysis clearer and faster.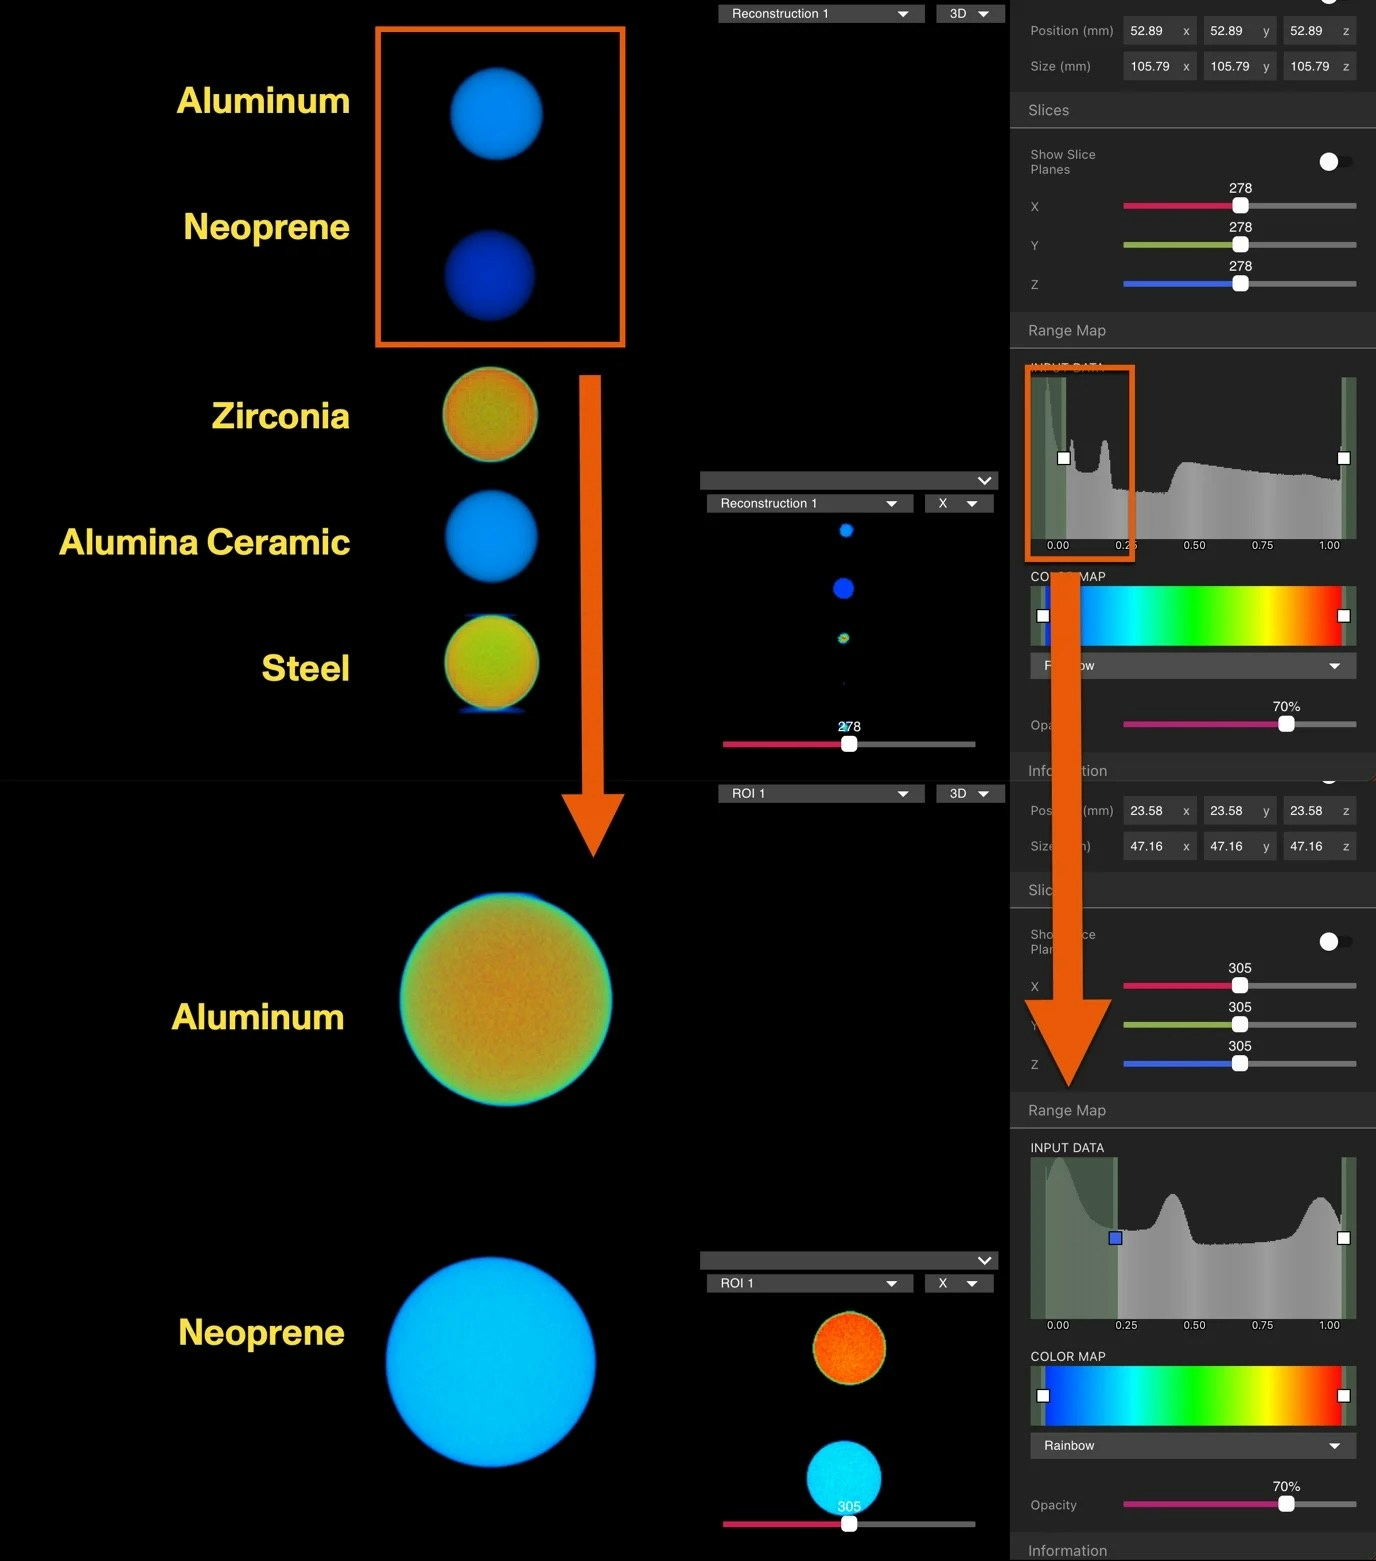
Enhanced resolution
ROIs can increase effective resolution by reducing the working volume. This is especially helpful when inspecting fine details such as porosity or small features.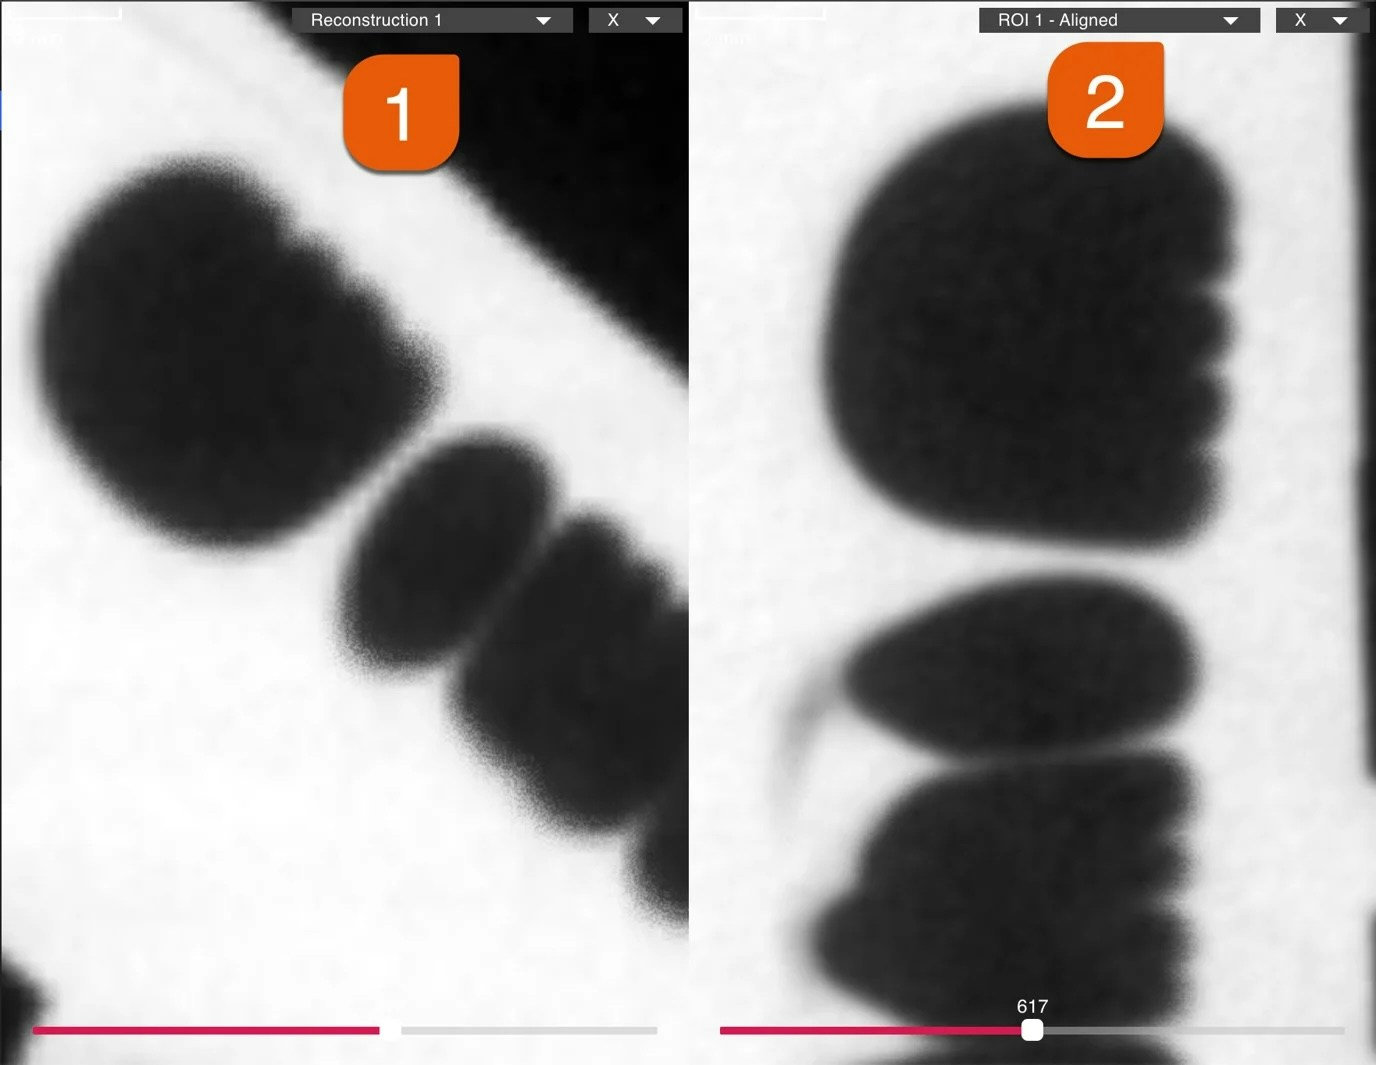 For workflows that require tight dimensional accuracy on a local feature, consider pairing ROI creation with ISO-50 Mesh + Dimensioning or CAD Comparison.
Video tutorial overview
Authoring an ROI
1: Initiating the ROI Workflow Editor
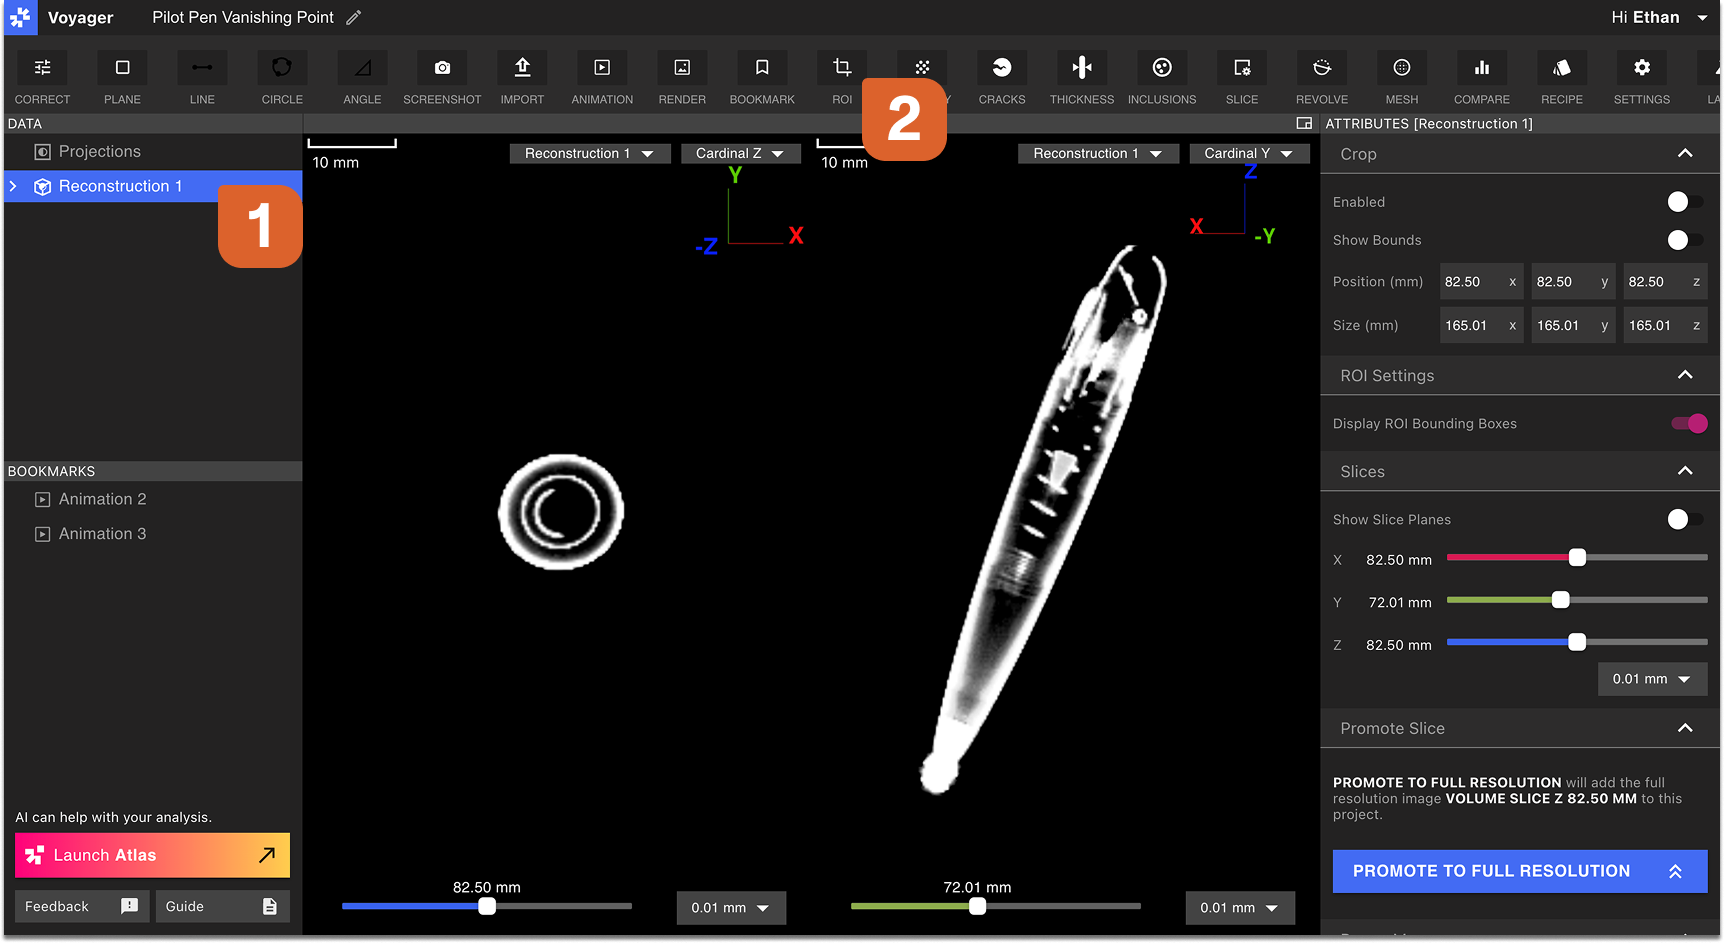
To create an ROI of a Reconstruction or other ROI, first select the desired parent Data Object in the Data Panel. Select the ROI Tool from the Toolbar to open the ROI Workflow Editor.
2: Overview (choose an ROI method)
Choose between one of the three options in the Overview tab of the ROI Workflow Editor:
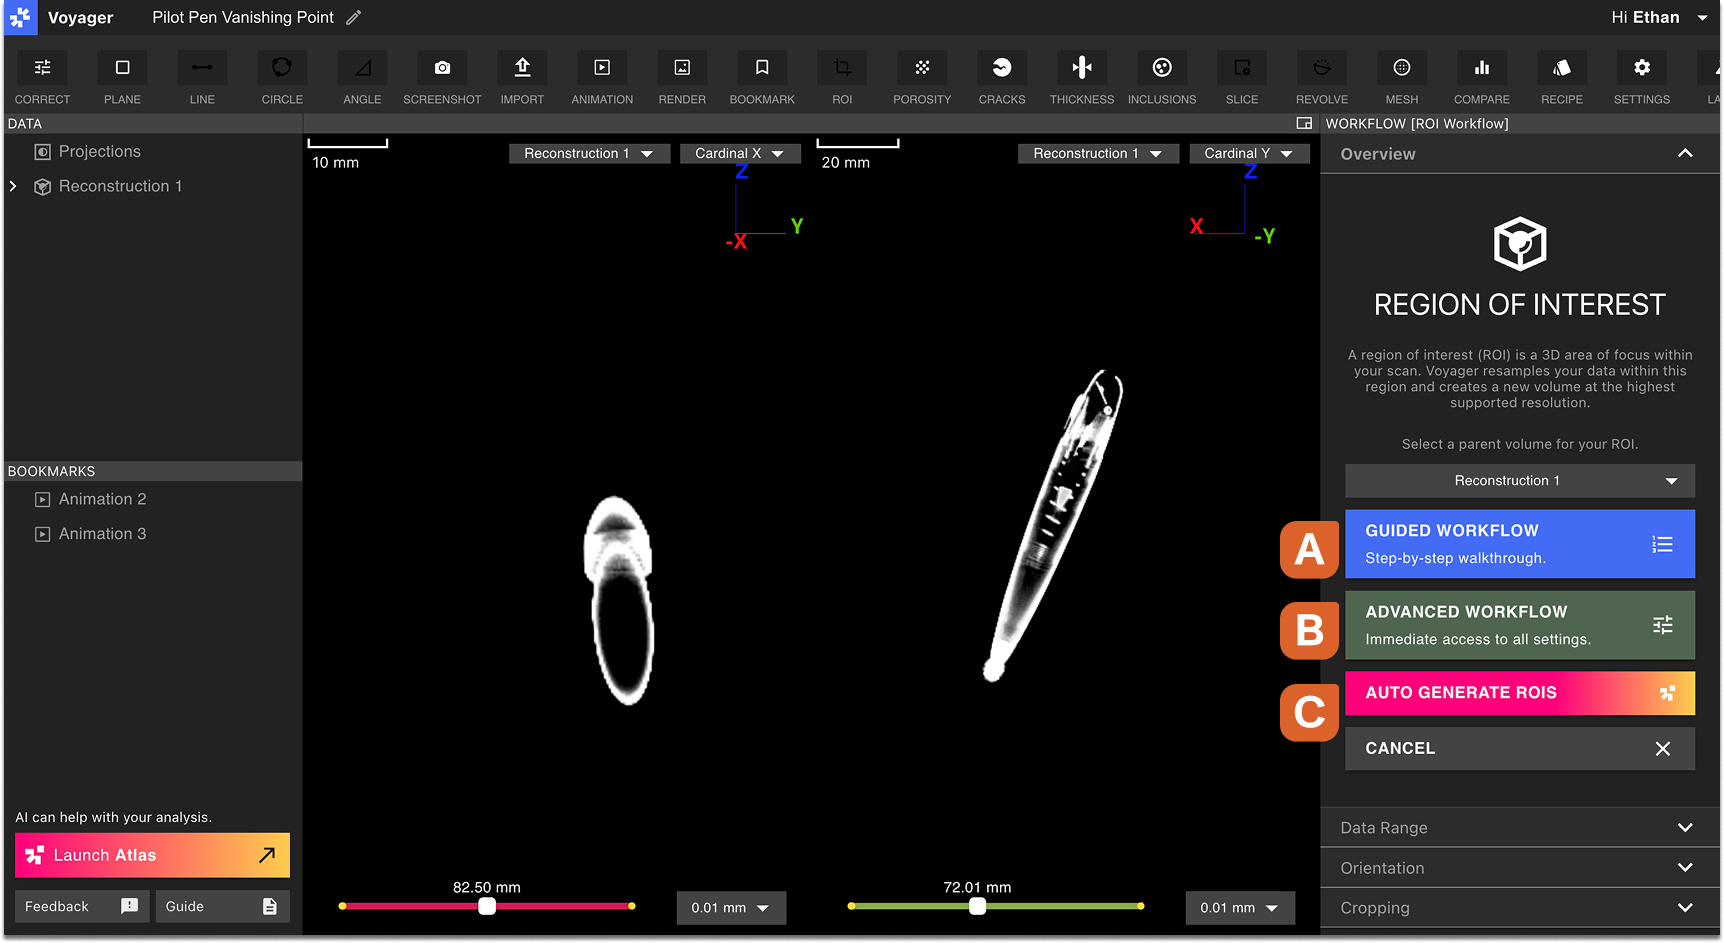 Option A: Guided Workflow
Sequentially specify the Data Range, Orientation, and Cropping of the ROI. This option is recommended for users who do not yet have substanial experience creating ROIs.
Option B: Advanced Workflow
Manually specify all settings of the ROI within a single Panel, switching freely between Data Range, Orientation, and Cropping settings.
Option C: Auto Generate ROIs
Let Voyager Atlas detect and create ROIs automatically, using AI to determine optimal Data Range, Orientation, and Cropping. Auto Generate ROIs may submit multiple Workflows to create ROIs around different components of the part, and any that are not useful can be deleted.
Option A: Guided Workflow
Sequentially specify the Data Range, Orientation, and Cropping of the ROI. This option is recommended for users who do not yet have substanial experience creating ROIs.
Option B: Advanced Workflow
Manually specify all settings of the ROI within a single Panel, switching freely between Data Range, Orientation, and Cropping settings.
Option C: Auto Generate ROIs
Let Voyager Atlas detect and create ROIs automatically, using AI to determine optimal Data Range, Orientation, and Cropping. Auto Generate ROIs may submit multiple Workflows to create ROIs around different components of the part, and any that are not useful can be deleted.
Change the parent volume of an ROI in the dropdown menu of the Overview Tab.
3: Data Range
The Data Range Tab includes visualization controls as well as a Renormalization setting. The visualization controls, explained further here, do not affect the Data Range of the new ROI.
Adjust the attenuation window to show nearly the full range of the scan. Exclude air for clarity, but keep fixtures, tape, and other materials visible at this stage—seeing the complete context helps with alignment.
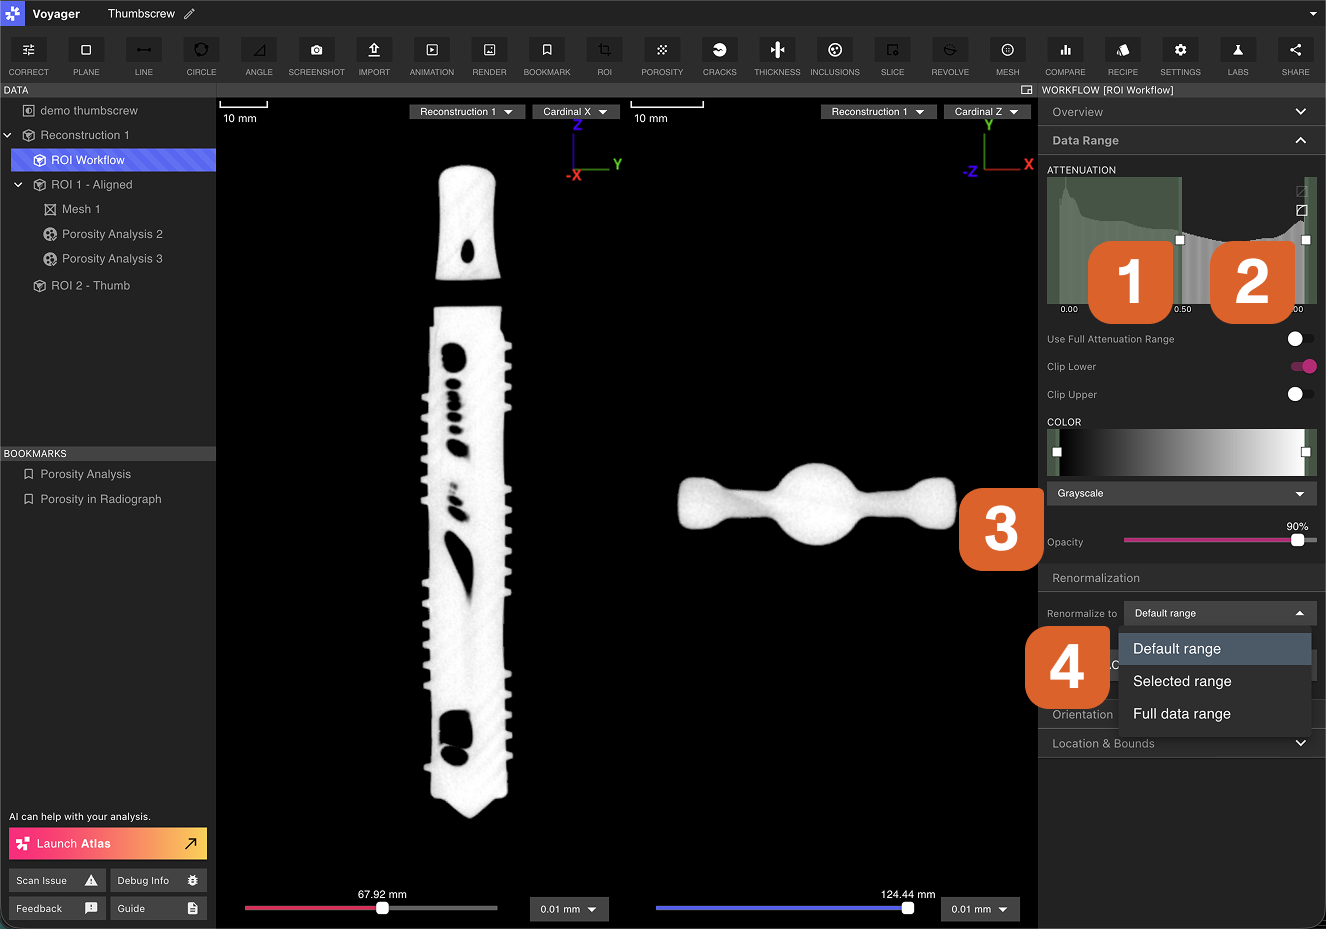
Return to fine-tune Data Range after alignment - for now, prioritize visibility over cleanup.
4: Orientation
Use the rotation handles to align the part to the preferred coordinate system. Consistent alignment of similar parts makes downstream measurements and comparisons more repeatable. Align flat surfaces of the object parallel to gridlines.
Toggle between the Cardinal X, Y, and Z planes and ensure that the part is aligned in all dimensions before continuing to the next step.
See the Inspection Planes article to learn about taking measurements once the part is aligned. 5: Cropping
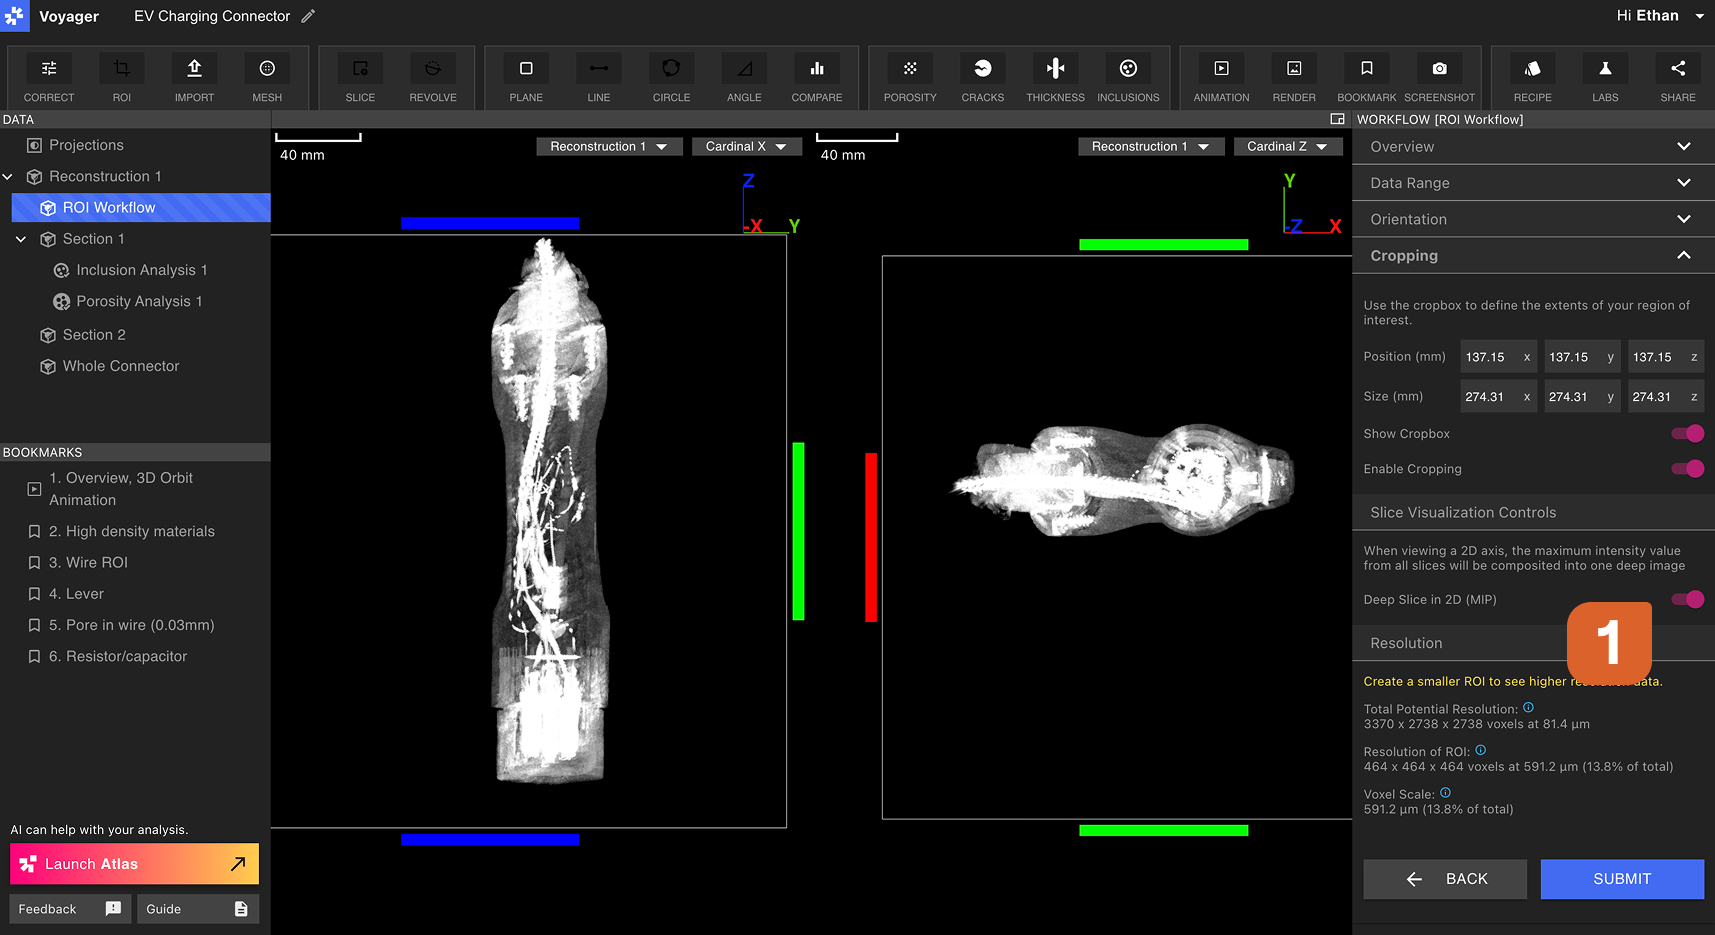
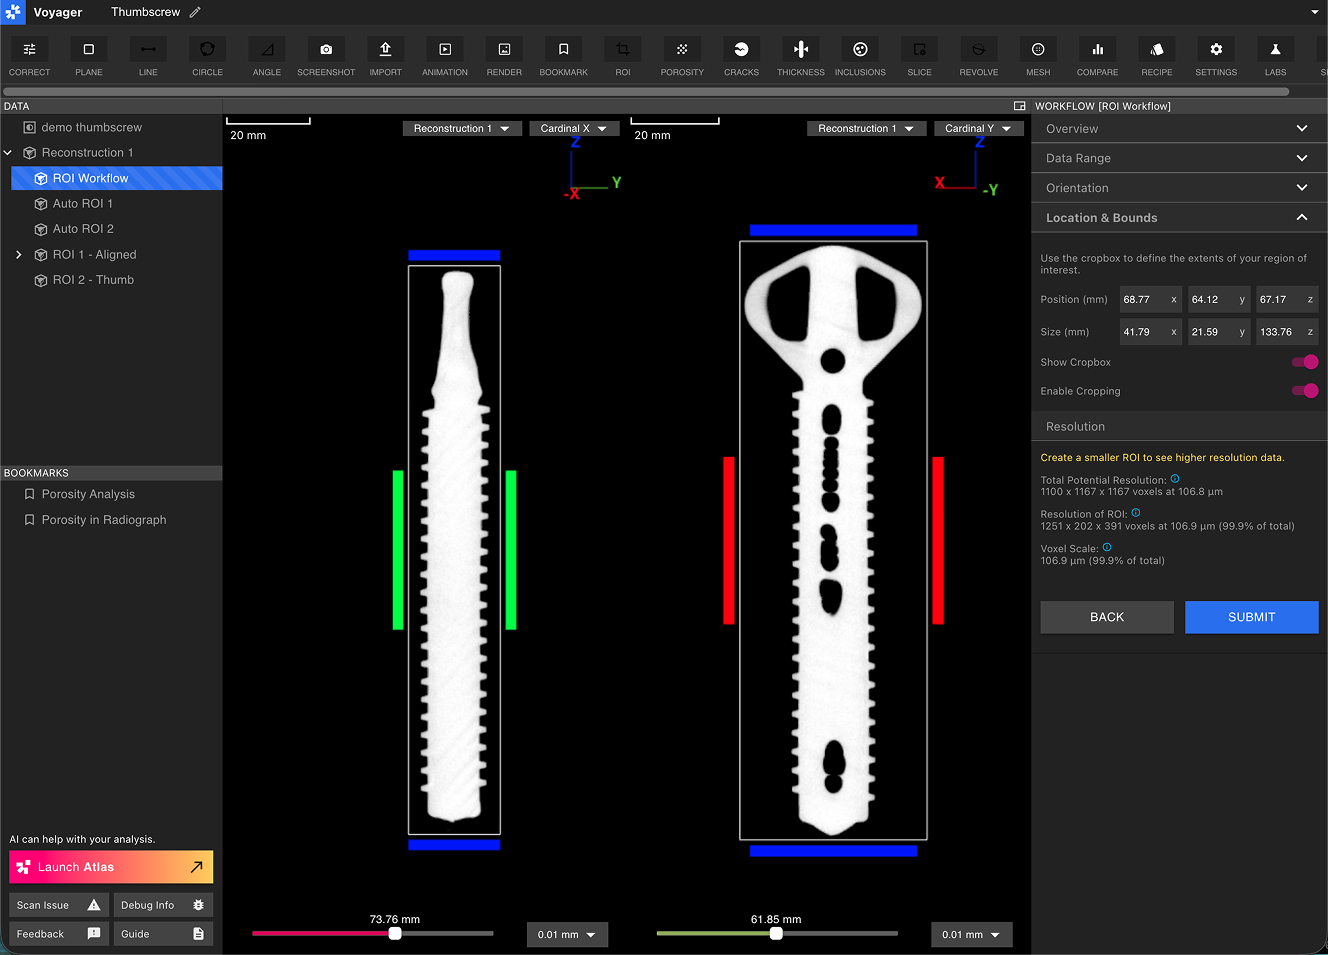
Use the cropping handles to define a tight bounding box around the ROI. As in step 4, toggle between the Cardinal X, Y, and Z planes and ensure that cropping handles are placed close to the edges of the part without cutting off relevant data. Select the 3D view to visualize the bounding box in the context of the full region.
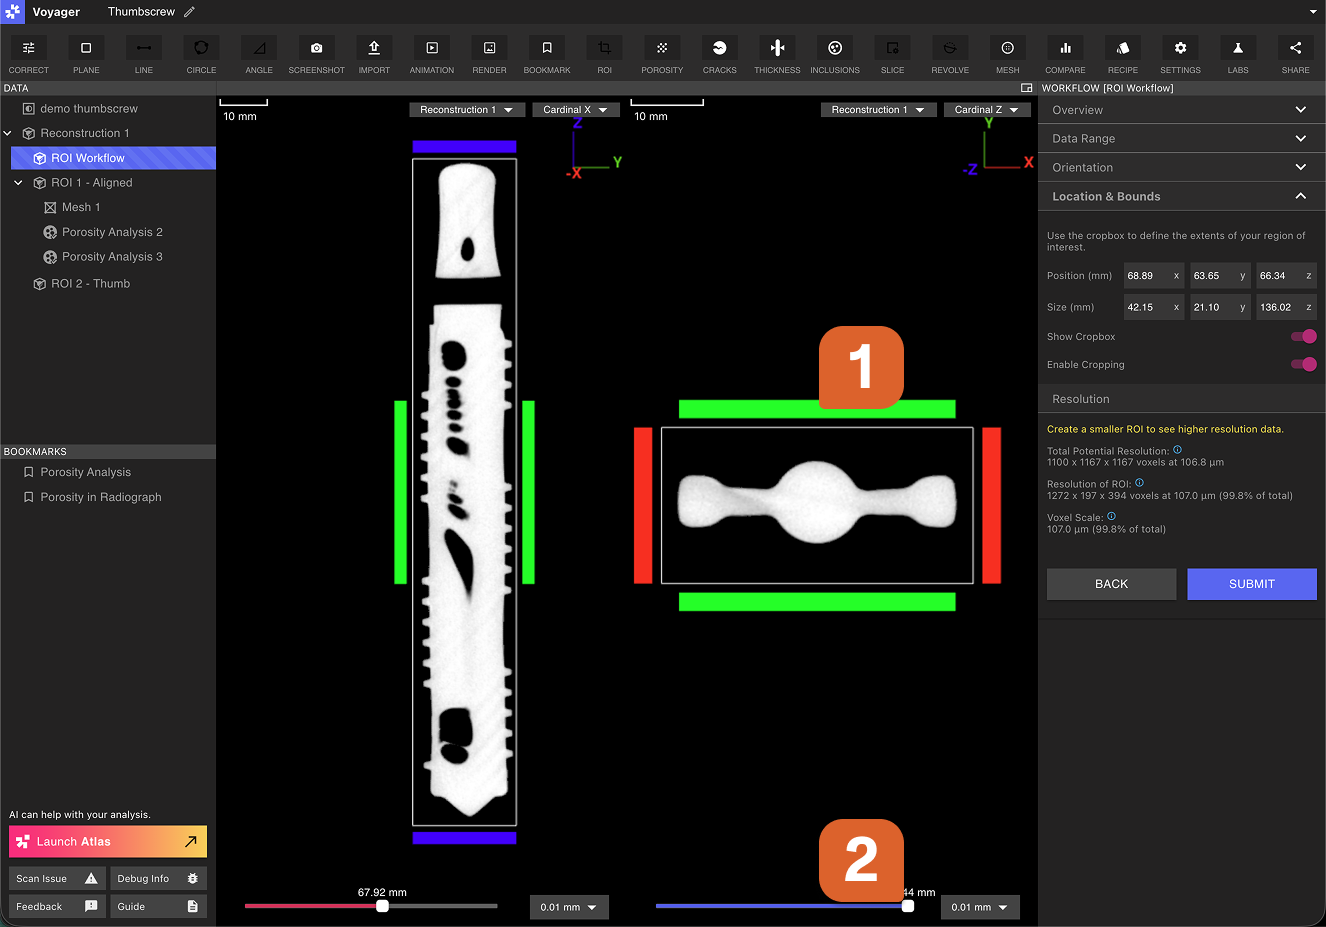
Make ROIs as focused as practical to maximize effective resolution and software responsiveness.
6: Submit Workflow
Review the ROI configuration in the Viewport and select Submit to kick off the ROI Workflow. When the Workflow complete, a notification will appear. After refreshing Voyager, a new ROI Data Object will appear in the Data Panel.
ROI organization + naming
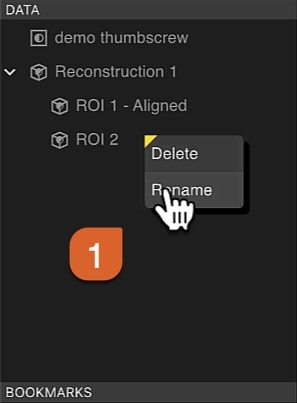
ROIs appear as siblings under their parent Reconstruction or ROI in the Data Panel. Descriptive names help track multiple ROIs. Right-click on any ROI to rename it for better organization, and use descriptive names to track multiple ROIs (e.g., “Aligned Threads”, “Cropped Head”, “Internal Features”).
Use ROIs as Workflow inputs: Feed ROIs into Recipes and analyses (e.g., Porosity, Inclusions, Crack Detection) to focus computations on relevant regions.