Overview
Voyager is Lumafield’s cloud-based software for managing, inspecting, and analyzing data captured on Neptune and Triton scanners. Whether you’re new to X-ray CT or a veteran, Voyager gives you the Tools to organize scan Projects, navigate reconstructed volumes, measure geometry, and run analysis Workflows. Voyager has two primary components:- The Project Editor for interactive visualization, measurement, and analysis of CT data
- The Dashboards for Project organization, Workspace management, and administrative settings
Voyager Project Editor
The Project Editor is Lumafield’s analysis software for interacting directly with CT scan data — creating and navigating data, measuring geometries, and running analysis Workflows. See Getting Around for the layout.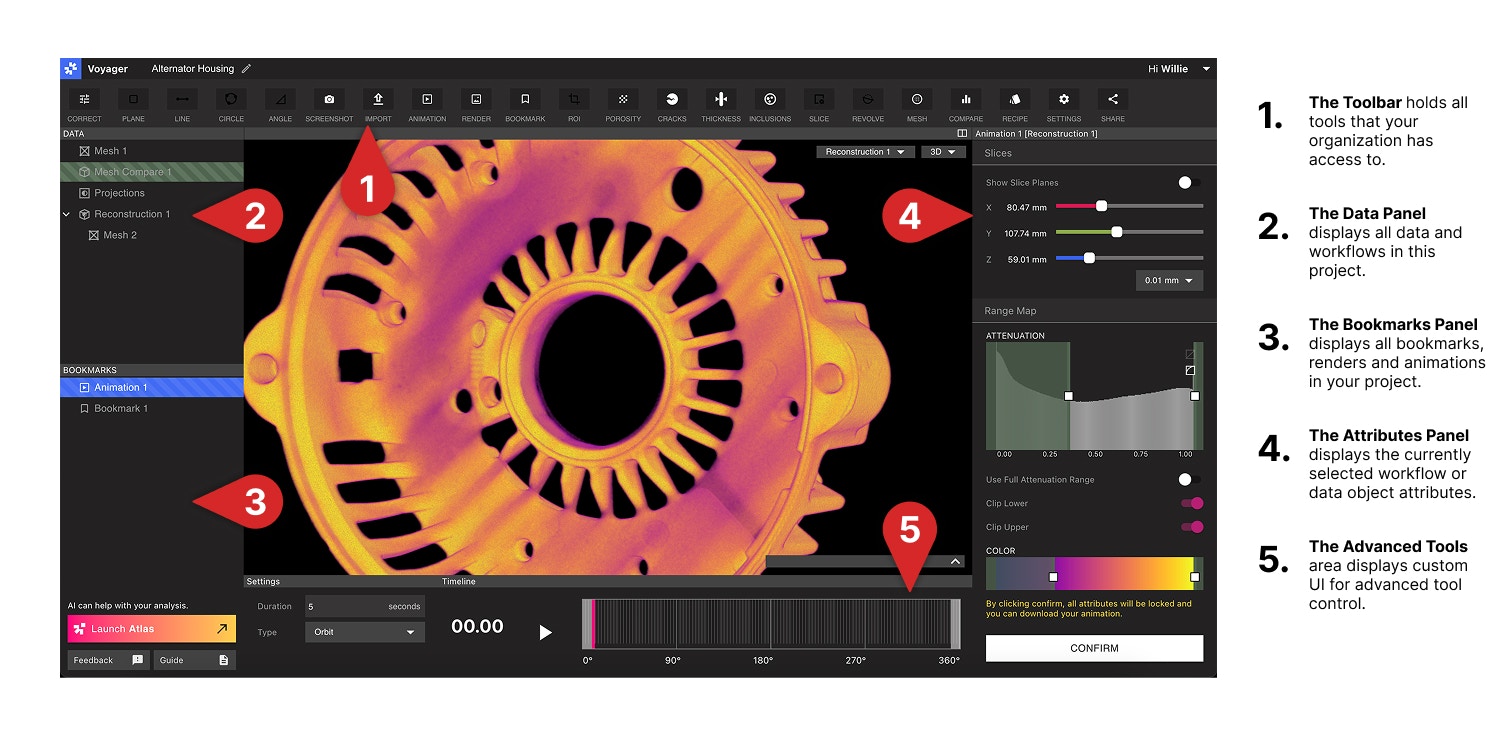
Voyager Modes
As of Voyager 2.0, the Toolbar is organized into three task-focused Modes. Switching Modes preserves your data — only the Tool set changes.Analysis Mode
ROIs, Inspection Planes, Measurement Tools, Mesh, Compare, and the full Integrity Analysis suite (Porosity, Inclusion, Crack, Wall Thickness).
Dimensioning Mode
The 3D Auto-Dimensioning GD&T suite — Direct Dimensions, Flatness, Datums, and Profile — built on Automatic Feature Extraction.
Analysis Mode data
In Analysis Mode, the Project Editor organizes Project data into the following types, each rendered as a Data Object:- Projections — raw X-ray radiographs captured during the scan
- Reconstruction — the full CT volume reconstructed from those Projections
- Region of Interest (ROI) — an oriented sub-volume of a Reconstruction or another ROI
- Plane — a slice-based view that enables 2D measurement
- Mesh — a surface representation produced by the Mesh Tool or imported via the Import Tool
- Analysis Results — outputs of Workflows (e.g. CAD Comparison, Porosity, Inclusion, Crack, and Wall Thickness)
Dimensioning Mode data
In Dimensioning Mode, the 3D Auto-Dimensioning suite produces a parallel set of GD&T-focused Data Objects on top of an oriented ROI:- Extracted Features — planes and cylinders produced by Automatic Feature Extraction; the inputs to every Tool in this Mode
- Full-part Mesh — a sub-voxel boundary mesh used by Profile
- Imported CAD —
.STEPnominal geometry loaded via the Import Tool for Profile evaluation; see Nominal CAD Import - Datums — Plane, Axis, and Midplane references built on extracted features (or on imported CAD)
- Datum Reference Frame (DRF) — a correlated set of datums spanning the part and the imported CAD
- Direct Dimensions — Distance, Angle, and Diameter measurements with tolerance and pass/fail color coding
- GD&T Evaluations — Flatness and Profile results, displayed as deviation heatmaps with tolerance-aware labels
Advanced Tools
Two sets of capabilities sit alongside the three Modes:- Recipes — automated, repeatable sequences of scan and analysis steps for your Organization.
- Labs — experimental Apps including the Data Quality Toolkit, ROI Copy & Paste, and 2D Dimensioning.
Voyager Dashboards
Voyager Dashboards are the organizational and administrative layer of Voyager.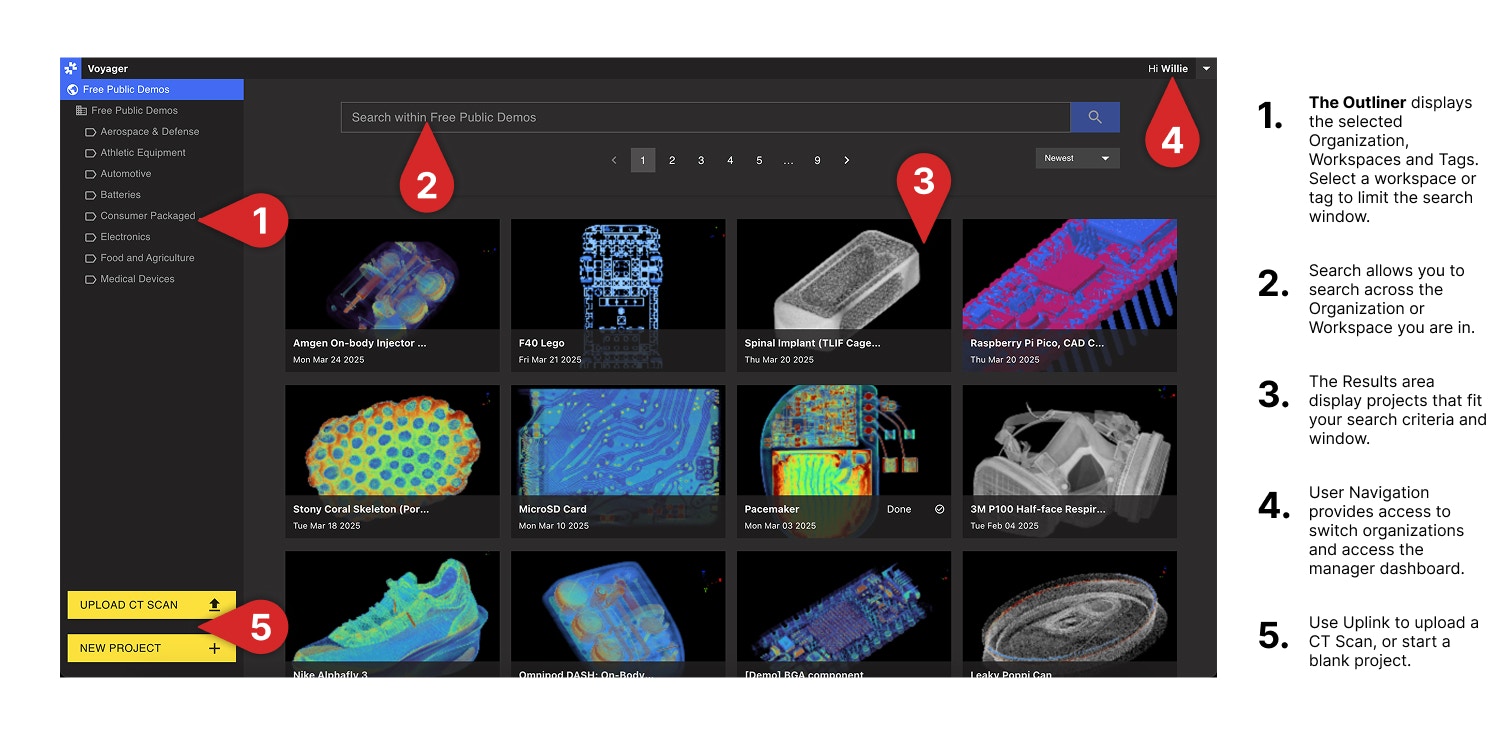
- The Project Dashboard is the central location for all CT Projects, automatically populated by completed scans. Use Tags and Bulk Actions to organize and search at scale, and view your Organization’s Workspaces — the access boundaries that group related Projects.
- The Manager Dashboard provides controls for user management, Workspace creation, scanner access, and Organization-wide settings. Access is limited to Organization Managers.
Voyager Configurations
Voyager is offered as Cloud, GovCloud, and On-Prem.- Voyager Cloud is Lumafield’s standard hosted deployment, with Lumafield-managed software releases for supported hardware systems.
- Voyager GovCloud provides a similar deployment model for customers with elevated security and compliance requirements.
- Voyager On-Prem is installed within your environment, with software releases coordinated through Lumafield. See our On-Prem Power guide for server restart instructions.